Candidates can download NCERT Exemplar Class 10 Maths Unit 13 from this page. The exemplar has been provided by the National Council of Educational Research & Training (NCERT) and the candidates can check it from below for free of cost. It contains objective, very short answer type, short answer type, and long answer type questions. Along with it, the answer for each question has also been provided. From the NCERT Exemplar Class 10 Maths Unit 13, candidates can understand the level and type of questions that are asked in the exam.
NCERT Exemplar Class 10 Maths Unit 13 Statistics and Probability
NCERT Class 10 Maths Unit 13 is for Statistics and Probability. The type of questions that will be asked from NCERT Class 10 Maths Unit 13 are displayed in the below provided NCERT Exemplar Class 10 Maths Unit 13. With the help of it, candidates can prepare well for the examination.
Also Check: NCERT Solutions for Class 10 Maths
Main Concepts & Results
Statistics: Measures of Central Tendency
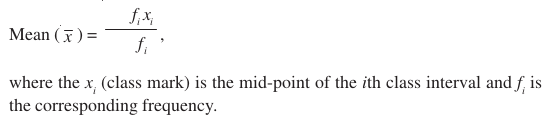
(a) Mean of Grouped Data
(i) To find the mean of grouped data, it is assumed that the frequency of each class interval is centred around its mid-point.
(ii) Direct Method
(iii) Assumed Mean Method

(iv) Step-deviation Method
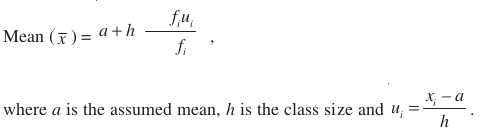
(v) If the class sizes are unequal, the formula in (iv) can still be applied by
taking h to be a suitable divisor of all the  .
.
(b) Mode of Grouped Data
(i) In a grouped frequency distribution, it is not possible to determine the mode by looking at the frequencies. To find the mode of grouped data, locate the class with the maximum frequency. This class is known as the modal class. The mode of the data is a value inside the modal class.
(ii) Mode of the grouped data can be calculated by using the formula

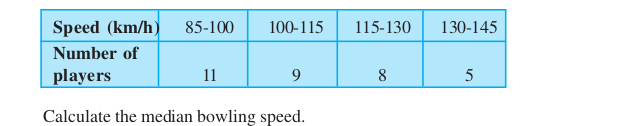
(c) Median of Grouped Data
(i) Cumulative frequency table – the less than type and the more than type of the grouped frequency distribution.
(ii) If n is the total number of observations, locate the class whose cumulative frequency is greater than (and nearest to)  This class is called the median class.
(iii) Median of the grouped data can be calculated by using the formula:

where l is the lower limit of the median class, n is the number of observations, h is the class size, cf is the cumulative frequency of the class preceding the median class and f is the frequency of the median class.
(d) Graphical Representation of Cumulative Frequency Distribution (Ogive) – Less than type and more than type.
(i) To find median from the graph of cumulative frequency distribution (less than type) of a grouped data.
(ii) To find median from the graphs of cumulative frequency distributions (of less than type and more than type) as the abscissa of the point of intersection of the graphs.
Probability

Multiple Choice Questions (Solved Examples)


Multiple Choice Questions (Exercise)
Exercise- 13.1


Short Answer Questions with Reasoning (Solved Examples)

Short Answer Questions with Reasoning (Exercise)
Exercise- 13.2


Short Answer Type Questions (Solved Examples)


Short Answer Type Questions (Exercise)
Exercise- 13.3


Long Answer Questions (Solved Examples)


| « Previous |