NCERT Solutions for Class 11 Economics Chapter 6 Correlation has been published by Aglasem. You can now download the Class 11 Economics Ch 6 Questions and Answers PDF here. This NCERT Solutions for Class 11 Economics contains answers of all questions asked in Chapter 6 in textbook, Statistics for Economics. Therefore you can refer it to solve Correlation exercise questions and learn more about the topic.
NCERT Solutions for Class 11 Economics Chapter 6 Correlation
Class – Class 11
Subject – Economics
Chapter – Ch 6
Chapter Name – Correlation
Book – Statistics for Economics
Study Material – NCERT Solutions
NCERT Solutions for Class 11 Economics Chapter 6 PDF
While you can read NCERT Solutions for Class 11 Economics Ch 6 for all exercises here on aglasem. You can also download this NCERT Solutions PDF to refer ncer question answer at anytime when you study Correlation. Here it is.
NCERT Solutions for Class 11 Economics Chapter 6 PDF Download Link – Click Here to Download Solutions PDF
How to download NCERT Solutions for Class 11 Economics Chapter 6 PDF?
You can download the complete NCERT solutions for chapter 6 of this NCERT Book i.e. Statistics for Economics with following steps.
- First search NCERT Solutions for Class 11 Economics Ch 6 PDF aglasem and come to this page.
- Now you will see the exercise questions answers of Correlation and download pdf link on it.
- Click the Download PDF link to obtain the Correlation questions with answers document.
NCERT Solutions for Class 11 Economics
There are more chapters to study besides Correlation in this subject. So here are NCERT solutions for all topics of Economics taught in 11th class here at aglasem.
- Indian Economic Development
- Chapter 1 Indian Economy on the Eve of Independence
- Chapter 2 Indian Economy 1950-1990
- Chapter 3 Liberalisation, Privatisation and Globalisation : An Appraisal
- Chapter 4 Human Capital Formation in India
- Chapter 5 Rural Development
- Chapter 6 Employment: Growth, Informalisation and Other Issues
- Chapter 7 Environment and Sustainable Development
- Chapter 8 Comparative Development Experiences of India and its Neighbours
- Statistics for Economics
- Chapter 1 Introduction
- Chapter 2 Collection of Data
- Chapter 3 Organisation of Data
- Chapter 4 Presentation of Data
- Chapter 5 Measures of Central Tendency
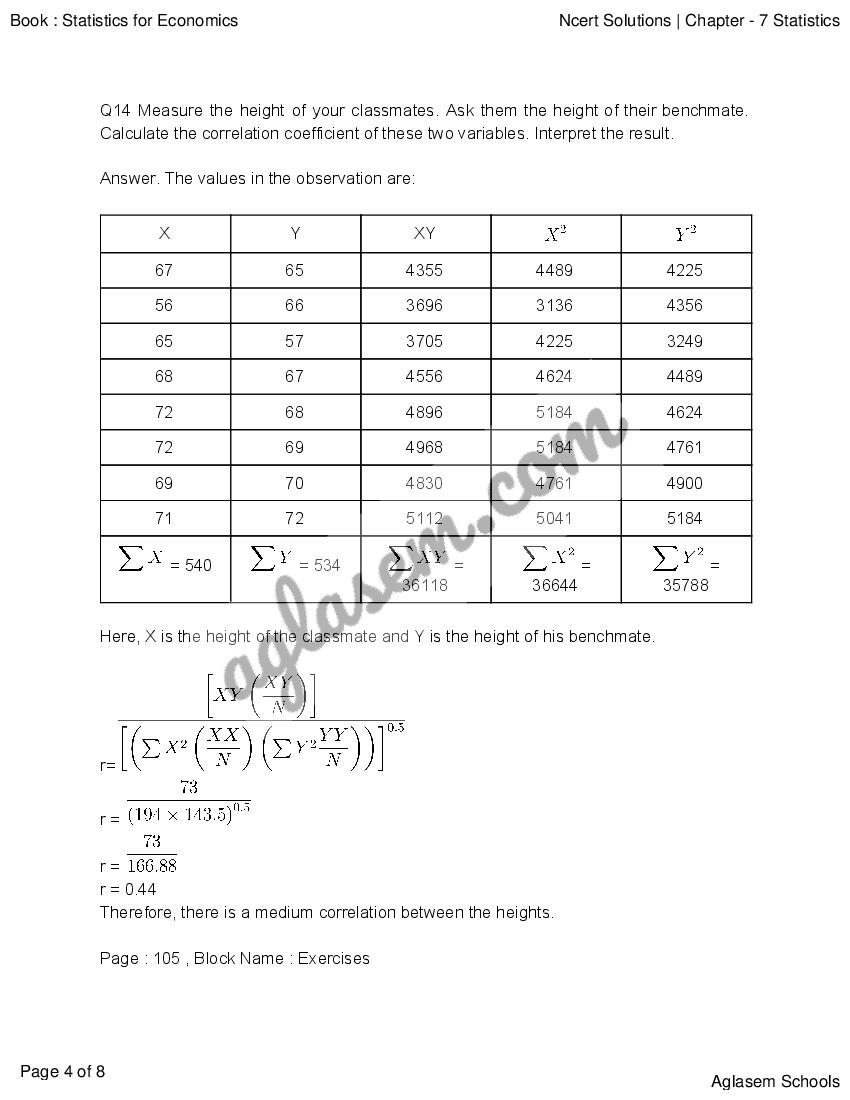
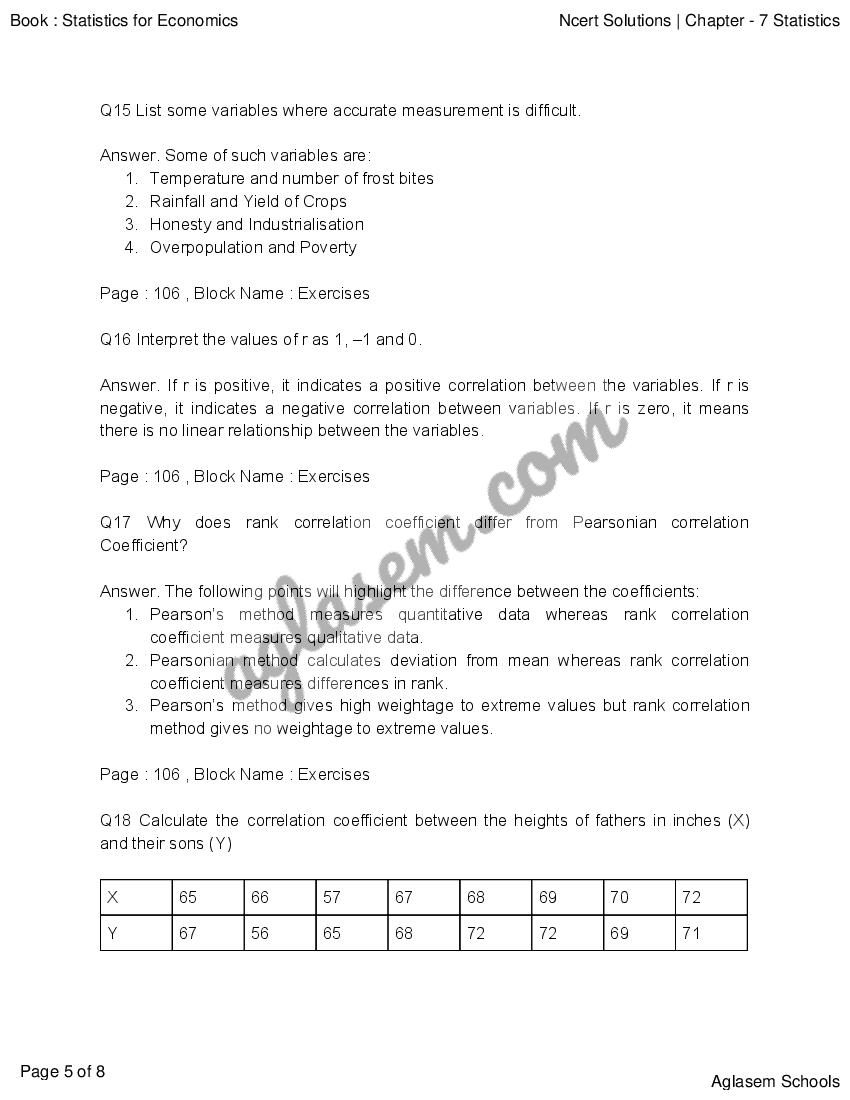
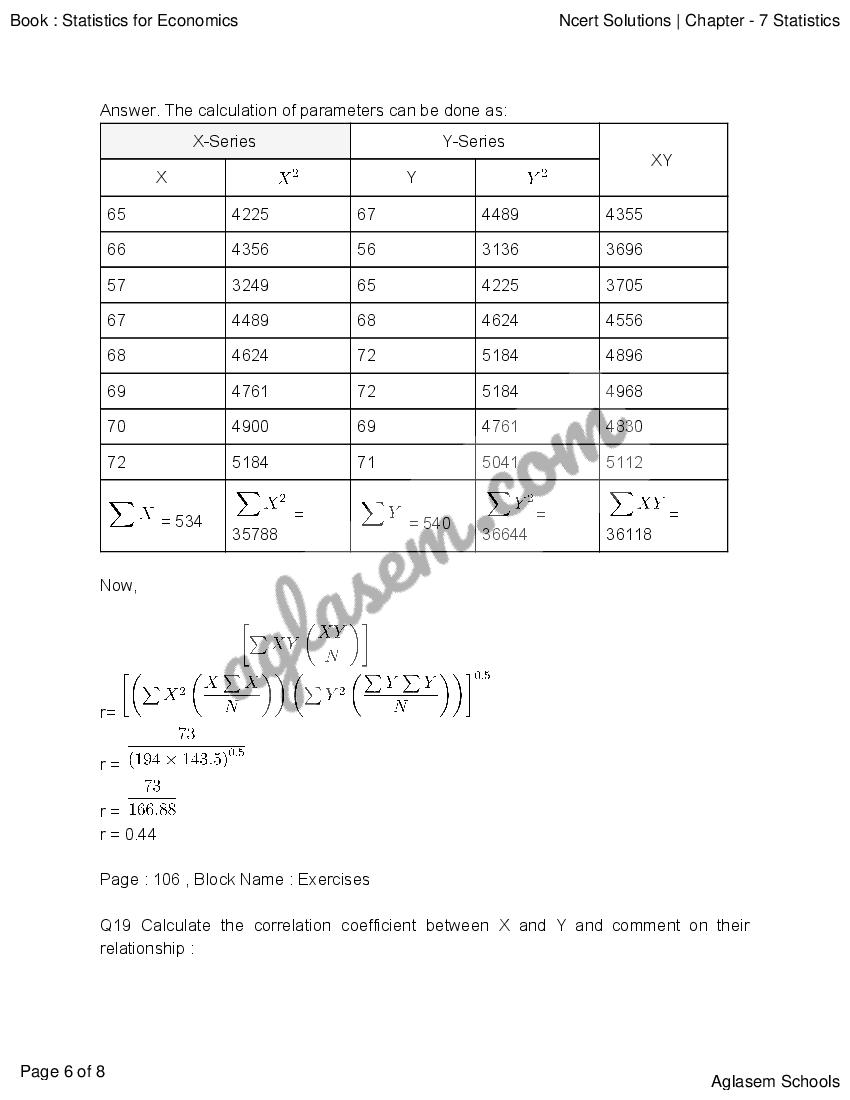
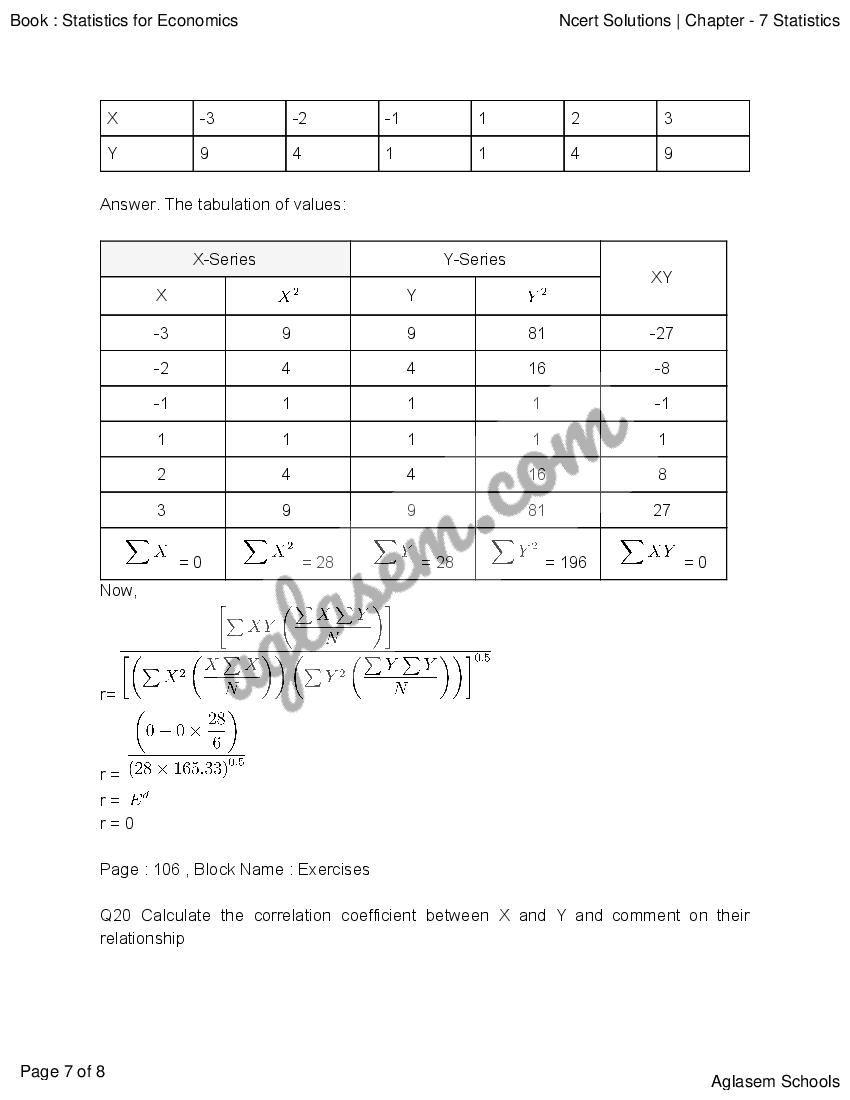
- Chapter 6 Correlation
- Chapter 7 Index Numbers
NCERT Solutions for Class 11
Just like you got Economics Ch 6 solutions here. You can see exercise questions answers of other subjects and their topics too on aglasem. Here are NCERT solutions for all subjects of 11th standard NCERT books.
- NCERT Solutions for Class 11 Accountancy
- NCERT Solutions for Class 11 Biology
- NCERT Solutions for Class 11 Business Studies
- NCERT Solutions for Class 11 Chemistry
- NCERT Solutions for Class 11 Economics
- NCERT Solutions for Class 11 English
- NCERT Solutions for Class 11 Geography
- NCERT Solutions for Class 11 Hindi
- NCERT Solutions for Class 11 History
- NCERT Solutions for Class 11 Maths
- NCERT Solutions for Class 11 Physics
- NCERT Solutions for Class 11 Political Science
- NCERT Solutions for Class 11 Psychology
- NCERT Solutions for Class 11 Sociology
NCERT Solutions for Class 11 Economics Chapter 6 – An Overview
The key highlights of this study material are as follows.
| Aspects | Details |
|---|---|
| Class | Class 11 |
| Subject | Economics |
| Chapter Number | Ch 6 |
| Chapter Name | Correlation |
| Book Name | Statistics for Economics |
| Book By | NCERT (National Council of Educational Research and Training) |
| Educational Resource Here | NCERT Solutions of Class 11 Economics Ch 6 for All Exercise |
| More Questions Answers of This Subject | NCERT Solutions for Class 11 Economics |
| Download Book Chapter PDF | NCERT Book Class 11 Economics Chapter 6 |
| All Questions Answers For This Class | NCERT Solutions for Class 11 |
| Complete Solutions | NCERT Solutions |
If you have any queries on NCERT Solutions for Class 11 Economics Chapter 6 Correlation, then please ask in comments below.