NCERT Solutions for Class 9 Maths Chapter 10 How Quantities Combine: Understanding Data – step-by-step answers to every exercise and in-text question of the chapter, as per the latest NCERT syllabus for 2027. Read them online or download the free question-answer PDF.
Chapter 10 asks what happens to an average when groups of data, mixtures or marks are combined. Averaging the averages works only when the groups are the same size; otherwise each part must count according to its size or importance, which gives the weighted mean (Brahmagupta, c. 628 CE). The second half turns to pictures of combined data: stacked bar charts, which show totals and their parts, and 100% stacked bar charts, which show shares. You will learn to compute weighted means and to judge what each chart can and cannot tell you.
NCERT Solutions for Class 9 Maths Chapter 10 How Quantities Combine: Understanding Data PDF
All the answers are on this page below. The PDF also explains every answer – why it is right and how to check it – so download it for revision.
| Chapter | Download | |
|---|---|---|
| Solutions PDF | How Quantities Combine: Understanding Data | View PDF |
NCERT Solutions for Class 9 Maths Chapter 10 How Quantities Combine: Understanding Data – Questions and Answers
All 60 questions of the chapter (textbook pages Part II, 8 – 36) are answered below, in the order of the book – in-text questions, activities and the end-of-chapter exercises. Each answer is written the way you would write it in the exam.
Think and Reflect — Page 8Section 10.1.1 Average of Averages (Example 1)
| Heights (in cm) | Average Height (in cm) | |
|---|---|---|
| Seniors | 165, 169, 164, 167, 170, 159, 164, 166 | 165.5 |
| Juniors | 146, 149, 153 | 149.33 |
Why did Method 1 not work?
Method 1 gives the two group averages equal importance, as if there were as many juniors as seniors. But there are 8 seniors and only 3 juniors. Each senior’s height should count once, so the seniors’ average must count 8 times and the juniors’ average only 3 times.
= (1324 + 448) ÷ 11 = 1772 ÷ 11 ≈ 161.09 cm
Method 1 pulls the answer down towards the juniors’ average, so it is too small (157.4 cm).
Exercise Set 10.1 — Page 13Sections 10.1.1 Average of Averages and 10.1.2 Mixtures
Total score of Section B = 76 × 25 = 1900
Combined average = (2160 + 1900) ÷ (30 + 25)
= 4060 ÷ 55 ≈ 73.82
The combined average is about 73.82. It is closer to 72 than to 76 because Section A has more students.
The quantities are equal, so the fraction in the mixture is the simple average of the three fractions.
Sum = 99⁄300 = 33⁄100
Fraction of nitrogen = 33⁄100 ÷ 3 = 11⁄100 (that is, 11%)
Suppose a goldsmith melts together three pieces of gold: 9 units at 12 varṇa, 5 units at 10 varṇa, and 17 units at 11 varṇa. Find the purity in varṇa of the combined gold.
Purity of the mixture is the weighted mean of the purities, with the amounts as weights.
= (108 + 50 + 187) ÷ 31
= 345 ÷ 31 = 114⁄31 ≈ 11.13 varṇa
May and July have 31 days and June has 30 days, so each month’s average is weighted by its number of days.
= (108.5 + 300 + 269.7) ÷ 92 = 678.2 ÷ 92
≈ 7.37 mm per day
(i) A 100 mL kashayam/kadha with 5% spice mix, a 200 mL one with 10% spice mix, and a 300 mL one with 15% spice mix are combined.
(ii) A 300 mL kashayam/kadha with 5% spice mix, a 200 mL one with 10% spice mix, and a 100 mL one with 15% spice mix are mixed.
Concentration = 70 ÷ 600 ≈ 11.67%
(ii) Spice = 300 × 0.05 + 200 × 0.10 + 100 × 0.15 = 15 + 20 + 15 = 50 mL
Concentration = 50 ÷ 600 ≈ 8.33%
The same three strengths give different results because the amounts are swapped: in (i) most of the drink is 15%, in (ii) most of it is 5%.
Exercise Set 10.2 — Pages 14–15Section 10.1.3 Custom Weights
(ii) [35⁄100 × 3 + 44⁄100 × 4 + 80⁄100 × 5] ÷ (3 + 4 + 5)
(iii) {[35⁄50 × 3 + 44⁄60 × 4 + 80⁄100 × 5] ÷ (3 + 4 + 5)} × 100
(iv) [(35⁄50 × 100) × 3 + (44⁄60 × 100) × 4 + (80⁄100 × 100) × 5] ÷ (3 + 4 + 5)
(iii) and (iv) are correct.
First change each mark to a percentage of its own maximum: 35/50 = 70%, 44/60 ≈ 73.33%, 80/100 = 80%. Then take the weighted mean with weights 3, 4, 5.
= (210 + 293.33 + 400) ÷ 12 ≈ 75.28%
(i) and (ii) are wrong: they treat 35 and 44 as if they were out of 100, but they are out of 50 and 60. (ii) also gives a fraction, not a percentage.
Exercise Set 10.3 — Pages 15–18Section 10.1 Combining Things: weighted mean in different situations
Profit on covers = 50% of ₹1000 = ₹500
Total profit = ₹2900 on total sales of ₹9000
Profit percentage = 2900 ÷ 9000 × 100 ≈ 32.22%
It is close to 30% because most of the sales (₹8000 of ₹9000) came from books.
Guess: a little more than 44.5 km, because one day out of 21 is above the average.
Distance in 21 days = 890 + 55 = 945 km
New average = 945 ÷ 21 = 45 km per day
(i) Salt: 5%, Sugar: 8% (ii) Salt: 13%, Sugar: 3%
(iii) Salt: 6%, Sugar: 6% (iv) Salt: 5.55%, Sugar: 8.88%
(v) Salt: 3.33%, Sugar: 2.67% (vi) Salt: 4.1%, Sugar: 7.08%
The correct option is (v).
Total mixture = 600 + 300 = 900 mL
Salt = 30 ÷ 900 × 100 ≈ 3.33%
Sugar = 24 ÷ 900 × 100 ≈ 2.67%
Each substance is now spread through a larger volume, so both concentrations fall.
Required concentration = 3⁄4 × 8% = 6%
Let w litres of water be added (water has 0% spice):
0.8 ÷ (10 + w) = 0.06
10 + w = 0.8 ÷ 0.06 = 13.33…
w = 3.33… = 10⁄3 litres ≈ 3.33 L
(i) Find out whose total is more without calculating.
(ii) What are their final marks?
(i) Keerthi’s. Both have 65 in flexibility. Keerthi has 5 less in strength (weight 4) but 5 more in agility (weight 6). Agility has the larger weight, so her gain outweighs her loss.
= 985 ÷ 15 ≈ 65.67
Keerthi = (55 × 4 + 65 × 5 + 75 × 6) ÷ 15 = (220 + 325 + 450) ÷ 15
= 995 ÷ 15 ≈ 66.33
| 5★ | 4★ | 3★ | 2★ | 1★ | |
|---|---|---|---|---|---|
| Food | 5 | 3 | 2 | 0 | 0 |
| Ambience | 0 | 4 | 5 | 1 | 0 |
| Service | 1 | 2 | 2 | 4 | 1 |
Ambience = (4×4 + 3×5 + 2×1) ÷ 10 = 33 ÷ 10 = 3.3
Service = (5×1 + 4×2 + 3×2 + 2×4 + 1×1) ÷ 10 = 28 ÷ 10 = 2.8
Combined = (4.3 × 6 + 3.3 × 5 + 2.8 × 4) ÷ (6 + 5 + 4)
= (25.8 + 16.5 + 11.2) ÷ 15 = 53.5 ÷ 15 ≈ 3.57
The restaurant’s average rating is about 3.57 out of 5.
| Male langurs | Female langurs | All langurs | |
|---|---|---|---|
| Average weight | 16.5 kg | 13.8 kg | 14.925 kg |
| Number of langurs | 60 |
(b) (16.5x + 13.8y) ÷ 60 = – 14.925
(c) (16.5x + 13.8y) ÷ 2 = – 14.925
(d) (16.5x + 13.8y) ÷ (16.5 + 13.8) = – 14.925
(iii) A female langur weighing 15.2 kg is admitted to the facility. What is the average weight of the female langurs after this?
(iv) Two male langurs weighing 16.9 kg and 16.1 kg are released from the facility. What is the average weight of the male langurs after this?
(v) Now, suppose one of the male langurs lost 1 kg of weight. What is the average weight of all the male langurs after this?
More females. The overall average 14.925 kg is closer to the female average (13.8) than to the male average (16.5), so the females carry more weight in the mean.
(i) (a) is correct (x males, y females). Since x + y = 60, (b) is also correct if read as “= 14.925”. (c) and (d) are wrong.
828 + 2.7x = 895.5 ⇒ x = 25 males (35 females)
(iii) (35 × 13.8 + 15.2) ÷ 36 = 498.2 ÷ 36 ≈ 13.84 kg
(iv) (25 × 16.5 − 16.9 − 16.1) ÷ 23 = 379.5 ÷ 23 = 16.5 kg
(v) (379.5 − 1) ÷ 23 = 378.5 ÷ 23 ≈ 16.46 kg
So there are 25 male langurs.
| Water Source | Salinity |
|---|---|
| Dead Sea | ≈ 34% |
| Other seas and oceans | ≈ 3.5% |
| Ground water | ≈ 0.01% |
| Purified drinking water | ≈ 0.001% |
(ii) Is it possible to mix water from the Dead Sea and purified drinking water to get a mixture with the salinity of groundwater? Why/Why not? What quantity of purified drinking water should Dorjee mix with 1 litre of water from the Dead Sea to get a mixture having the salinity of groundwater?
(iii) Is it possible to mix water from the Dead Sea and groundwater to get a mixture with the salinity of purified drinking water? Why/Why not? What quantity of groundwater should he mix with 1 litre of water from the Dead Sea to get a mixture having the salinity of purified drinking water?
(ii) Yes, because 0.01% lies between 0.001% and 34%. Let w litres be added:
34 + 0.001w = 0.01 + 0.01w
33.99 = 0.009w ⇒ w ≈ 3777 litres
(iii) No. A mixture’s salinity always lies between the salinities of the parts, here between 0.01% and 34%. It can never fall to 0.001%, which is below both. So no quantity of groundwater works.
In-text Questions — Pages 18–20Section 10.2.1 Stacking Columns (cluster-column charts, Fig. 10.1)
| Housing | Food | Education | Transportation | Healthcare | Recreation | |
|---|---|---|---|---|---|---|
| Family A | 1940 | 1700 | 1280 | 1200 | 1770 | 535 |
| Family B | 1750 | 1546 | 1500 | 1280 | 1210 | 0 |
| Family C | 950 | 1700 | 1540 | 1400 | 1300 | 150 |
1. Which family spent the least on housing?
Family C (₹950). In Choice 1 the three housing bars stand side by side and Family C’s bar is clearly the shortest (Family A ₹1940, Family B ₹1750).
Family A (₹1770, against ₹1210 for Family B and ₹1300 for Family C). Choice 1 shows this at a glance: Family A’s healthcare bar is the tallest in the healthcare cluster.
About ₹1300 (the table gives ₹1280). On either chart the education bar for Family A ends a little above the 1000 line, roughly halfway to 1500.
Housing (₹1750). In Choice 2 all six of Family B’s bars are together, and the housing bar is the tallest; food (₹1546) and education (₹1500) come next.
On healthcare, but only slightly: ₹1770 on healthcare against ₹1700 on food. Choice 2 makes this easier, since both bars are in Family A’s cluster.
Choice 1 was easier for Questions 1 and 2, because they compare families within one category, and Choice 1 puts those bars side by side.
Choice 2 was easier for Questions 4 and 5, because they compare categories within one family, and Choice 2 keeps each family’s bars together.
Question 3 asks for one value, so both charts work equally well.
Family B: 1750 + 1546 + 1500 + 1280 + 1210 + 0 = ₹7286
Family C: 950 + 1700 + 1540 + 1400 + 1300 + 150 = ₹7040
Family C spent the least overall (₹7040).
About ₹7000 (exactly ₹950 + ₹1700 + ₹1540 + ₹1400 + ₹1300 + ₹150 = ₹7040).
About 13.5% (roughly one-seventh) of Family C’s expenses were on housing.
In-text Questions — Page 20Section 10.2.1 Stacking Columns (stacked bar chart, Fig. 10.2)
No, the cluster charts made us add six values per family. The stacked bar chart (Fig. 10.2) makes it simpler: each family’s bars are joined end to end, so the length of the whole bar is the family’s total.
6. Family C’s bar is the shortest, so Family C spent the least.
7. Family C’s bar ends at about ₹7000.
8. The housing (red) piece is about 950 of the 7000-long bar, roughly one-seventh, about 13–14%.
It is possible but harder.
Only the first piece (housing) starts at 0. Every other piece starts where the previous one ends, so to read, say, Family A’s education you must subtract the start from the end (about 4920 − 3640 = 1280). Also, the same category starts at different points in different bars, so comparing, for example, healthcare across families means comparing pieces that are not lined up.
Q1 (housing) is still easy, since housing starts at 0 in every bar. The others take more effort. Stacked bars make totals easy but individual parts harder.
Exercise Set 10.4 — Pages 21–22Section 10.2.1 Stacking Columns
(ii) Approximately how many reptile species were in the list in 2016?
(iii) Which class(es) of species have seen a relatively small increase in count between 2007 and 2019?
(i) 14,234 is the total number of animal species (all classes together) on the endangered list in 2019, that is, the full height of the 2019 column.
(ii) About 1,000 reptile species. The dark red reptile piece in 2016 is about one-third of the gap between 0 and 3,000.
(iii) Mammals, birds and amphibians. Their pieces are only a little taller in 2019 than in 2007 (a rise of roughly a tenth to a quarter), while reptiles, insects, molluscs, fish and others roughly doubled or more.
| Test | ODI | T20 | |
|---|---|---|---|
| Home | 62 | 100 | 32 |
| Overseas | 172 | 49 | 71 |
(i) comparing the total wickets taken at home vs. overseas:
(ii) the total wickets taken in each format:
(ii) Test: 62 + 172 = 234; ODI: 100 + 49 = 149; T20: 32 + 71 = 103
The bowler took more wickets overseas (292) than at home (194), and the most in Test matches (234).
In-text Questions — Page 22Section 10.2.2 An Alternative to Pie Chart
Family B: 1210 ÷ 7286 ≈ 16.6%
Family C: 1300 ÷ 7040 ≈ 18.5%
Family B has the smallest share for healthcare. It was not easy from Fig. 10.2: a “share” compares a piece with its own total, and the bars have different totals. Pie charts, or better a 100% stacked bar chart, show each family’s spending as parts of the same whole, so shares can be compared directly.
In-text Questions — Pages 23–24Section 10.2.2 Powering Up! (Example 7)
| Lighting | Cooling | Kitchen appliances | Other appliances | |
|---|---|---|---|---|
| 2005 | 360 | 300 | 120 | 220 |
| 2025 | 220 | 800 | 460 | 520 |
Some observations:
• Total use doubled, from 1000 units to 2000 units.
• Lighting fell from 360 to 220 units, and its share from 36% to 11%. More efficient bulbs (such as LEDs) could explain this.
• Cooling rose from 300 to 800 units and is now the biggest share (40%), perhaps from more air conditioners and hotter summers.
• Kitchen appliances rose almost four times (120 → 460) and their share nearly doubled (12% → 23%).
Interesting: cooling’s share rose only from 30% to 40%, but its amount rose 2.7 times. Shares hide how much the total grew; amounts hide how the mix changed. We need both charts.
Think and Reflect — Page 26Section 10.2.2 What Can We Infer? (Example 8)
| Number of blooms | Summer | Monsoon | Winter | Total |
|---|---|---|---|---|
| Case 1: Fatima | 105 | 63 | 42 | 210 |
| Case 1: Naveen | 48 | 30 | 42 | 120 |
| Case 2: Fatima | 90 | 54 | 36 | 180 |
| Case 2: Naveen | 96 | 60 | 84 | 240 |
A stacked bar shows actual amounts. From it we can compare totals, and parts within and across bars (for example, Fatima’s 105 summer blooms against Naveen’s 48).
A 100% stacked bar shows only proportions within each bar. It tells us that 50% of Fatima’s flowers bloomed in summer, but not how many. The same 100% chart fits Case 1 (Fatima has more summer blooms) and Case 2 (Naveen has more). So it cannot be used to compare actual numbers across bars.
Yes. A stacked bar chart gives each part’s actual value, so we can find each bar’s total and work out every part as a percentage of it. For example, Fatima in Case 1: 105 ÷ 210 = 50%, 63 ÷ 210 = 30%, 42 ÷ 210 = 20%.
No, not unless we are also told the total for each bar. The 100% chart gives only the percentages. Case 1 (totals 210 and 120) and Case 2 (totals 180 and 240) both give the same percentages, so we cannot tell which stacked chart it came from.
| Stacked bar chart | 100% stacked bar chart | |
|---|---|---|
| Shows | actual amounts | percentages (shares) of each bar’s total |
| Can compare | totals of different bars; parts within a bar; with care, parts across bars | shares within a bar; shares across bars (which group gives a bigger fraction to a part) |
| Cannot tell | shares easily (needs division) | actual amounts or totals |
For example, from Example 8’s 100% chart we can say “in Fatima’s garden more blooms came in summer than in monsoon”, but not “Fatima had more summer blooms than Naveen”.
In-text Questions — Page 26Section 10.2.2 A Typical Day (Example 9)
I notice:
Paid work 10% ≈ 2.4 h; Unpaid work & care 11% ≈ 2.6 h
Learning 5% ≈ 1.2 h; Leisure, social & travel 27% ≈ 6.5 h
Sleep is the biggest part (about one-third of the day), then leisure. Paid and unpaid work take about the same time. Learning is small.
I wonder: why is learning only about 1 hour when students spend 6–7 hours in school? Why is paid work only about 2.4 hours when working adults work about 8 hours? The reason is that this is an average over all Indians — children, workers, homemakers and the elderly — so it may not describe any real person well.
Think and Reflect — Page 27Section 10.2.2 A Typical Day (Fig. 10.6)
Interesting points and inferences:
• Children spend 22% (about 5.3 h) on learning and almost nothing on paid work; they also sleep the most (38%, about 9 h).
• Youth spend only 11% on learning but 7% on paid work and 9% on unpaid work: many have started working or helping at home.
• Adults spend about 29% (about 7 h) on paid plus unpaid work and almost no time learning.
• The elderly spend the most on leisure, social and travel (33%) and less on work.
• Personal care (13–14%) is almost the same for every age group.
So the “average Indian” of Fig. 10.5 hides big differences between age groups.
The usual trend is that sleep falls as people grow from childhood to adulthood: young children need the most sleep, teenagers a little less, and adults less still.
The chart mostly agrees: children 38% (about 9.1 h), youth 34% (about 8.2 h), adults 32% (about 7.7 h). The elderly (37%, about 8.9 h) do not follow the falling trend. This may be because many have retired and spend more time resting, and not because older people need more sleep.
Learning drops from 22% (about 5.3 h) to 11% (about 2.6 h) because:
• almost all 6–14-year-olds are in school, but in the 15–24 group many have finished or left studies, especially those aged 19–24;
• many youth have started paid work (7%) or take on household and care work (9%), which children hardly do;
• the 11% is an average: full-time college students may learn as much as children, but those who are not studying bring the average down.
On average, yes: adults spend 14% (about 3.4 h) on paid work and 15% (about 3.6 h) on unpaid work and care.
But this does not mean each adult splits the time equally. The average combines people who work long hours for pay with people (often homemakers) who do mainly unpaid household and care work. Surveys show that in India women do much more of the unpaid work and men more of the paid work. A chart split by gender would show this.
Think and Reflect — Page 28Section 10.2.2 A Typical Day
Yes. A strip for one day has a fixed length (24 hours), with small pieces for each activity in the order they happened. If we join all the pieces of the same activity (for example, all the sleep pieces) into one block, and keep the blocks in the same order in every strip, each strip becomes one stacked bar of length 24 h = 100%.
Several such strips side by side form a 100% stacked bar chart like Fig. 10.6. We lose only the time order of the activities, not how much time each takes.
Exercise Set 10.5 — Page 29Section 10.2.2 An Alternative to Pie Chart
| Lying down | Sitting | Standing or Moving around etc. | |
|---|---|---|---|
| Pavani (Patient) | 20 | 3 | 1 |
| Raghu (Nurse) | 7 | 4 | 13 |
| Zakir (Teacher) | 8 | 6 | 10 |
| Sahana (Student) | |||
| Julie (___________) | 8 | 10 | 6 |
(ii) Guess what activity or work Julie could be engaged in based on the data. Find out what your classmates’ guesses are.
(iii) Complete the chart below based on the tabular data.
(i) Sample guess: lying down 9 h (sleep), sitting 10 h (about 6 h in class, plus homework, meals and travel), standing/moving 5 h (games, walking, chores). Total = 24 h.
(ii) Julie sits for 10 hours and moves for 6, so she probably has a desk job, such as an office worker, bank clerk or computer operator. She could also be someone who sits while working, such as a tailor or a driver.
(iii) Each value ÷ 24 × 100 gives the percentage (Sahana: 9 h = 37.5%, 10 h ≈ 41.7%, 5 h ≈ 20.8%).
Think and Reflect — Page 30Section 10.2.2 (after Exercise Set 10.5)
Roughly similar, but not the same. Most teachers sleep about 7–8 hours, stand or walk while teaching, and sit while checking work, so the bar will have a similar shape. But the details depend on the person: a teacher who teaches mostly from a chair, travels a long way by bus, or plays sport after school will have a different mix.
Probably yes. Weekends are different from weekdays: people may sleep longer, students and teachers do not sit in class, a nurse may have a day off, and some people move around more doing chores or outings. The 7-day average would mix these days in, so the shares of lying down, sitting and moving would change, for example a little more lying down for most people.
Yes. For example:
• Raghu (nurse), mostly standing/moving: a shopkeeper who stands at the counter, a farmer, a delivery person, a traffic police officer, a waiter, a construction worker.
• Zakir (teacher), a mix: a salesperson, a doctor in a clinic, a chef.
• Julie, mostly sitting: an office worker, a driver, a tailor, a cashier, a software engineer.
• Pavani (patient), mostly lying down: a person recovering from an illness or injury, or a very elderly person who needs rest.
End-of-Chapter Exercises — Pages 30–36Whole chapter (questions marked * are optional/harder)
(i) In the second over they scored 12 runs. What is the run rate now?
(ii) After Over 19, their run rate was 6. What is the run rate after 20 overs given the team made 12 runs in the last over?
(ii) Runs after 19 overs = 6 × 19 = 114
Runs after 20 overs = 114 + 12 = 126
Run rate = 126 ÷ 20 = 6.3
In (i) one big over changes the run rate a lot; in (ii) the same 12 runs raise it only a little, because it is shared over 20 overs.
Yusuf: 40(N), 105(N), 383(F), 108(N), 165(F), 116(F)
Srikanth: 194(N), 85(N), 93(N), 121(N)
Kashvi: 49(N), 297(F), 105(N), 275(F), 40(N)
Prasanna: 124(N), 333(F), 182(N), 258(F)
Gracy: 220(F), 458(F), 129(F), 183(N)
Can you describe a way they can work together to find the average price of a shuttlecock across types?
(i) Each one calculated the average of the prices they had gathered. Suppose these are ay, as, ak, ap, ag respectively. Write an expression that gives the combined average.
(ii) Suppose an, af are the average prices of the nylon shuttlecocks and the feather shuttlecocks, respectively. Write an expression that gives the average price of a shuttlecock. Will this be equal to the answer we got using the method in the previous part?
Way: each friend tells the others the total of their prices and how many prices they have (or their average and count). Add all the totals and divide by the total count, 6 + 4 + 5 + 4 + 4 = 23.
(ii) There are 13 nylon and 10 feather prices:
Average = (13an + 10af) ÷ 23
Yes, the two are equal. Both numerators are the sum of all 23 prices (₹4063), so both give 4063 ÷ 23 ≈ ₹176.65.
(i) Shreyas buys 10 shares of this company at a price of ₹30 each. What is the average price per share for him after the purchase?
(ii) Vaishnavi buys some shares of this company at a price of ₹30 each and the average price per share for her after the purchase is ₹70. How many shares did she buy?
= (3750 + 300) ÷ 35 = 4050 ÷ 35 ≈ ₹115.71
(ii) Let her buy n shares:
(5 × 150 + 30n) ÷ (5 + n) = 70
750 + 30n = 350 + 70n
400 = 40n ⇒ n = 10 shares
A pool 30 hastas long is dug to different depths along its length. It is divided into 5 sections having lengths 4, 5, 6, 7, and 8 hastas, and is dug to depths of 9, 7, 7, 3, and 2 hastas, respectively. Find the mean depth of the pool.
Use Brahmagupta’s weighted mean with the section lengths as weights.
= (36 + 35 + 42 + 21 + 16) ÷ 30 = 150 ÷ 30
= 5 hastas
(iii) Purchase 1 g gold at ₹10k (iv) Purchase 10 g gold at ₹10k
(v) Purchase 0.5 g gold at ₹30k (vi) Purchase 0.5 g gold at ₹15k
(ii) (15 + 2 × 30) ÷ 3 = 25k
(iii) (15 + 10) ÷ 2 = 12.5k
(iv) (15 + 10 × 10) ÷ 11 ≈ 10.45k
(v) (15 + 0.5 × 30) ÷ 1.5 = 20k
(vi) (15 + 0.5 × 15) ÷ 1.5 = 15k
It does not change.
Experiment: values 10, 20 with weights 1, 3 give (10 + 60) ÷ 4 = 17.5; with weights 2, 6 they give (20 + 120) ÷ 8 = 17.5.
= 2(w₁x₁ + … + wₙxₙ) ÷ 2(w₁ + … + wₙ)
= (w₁x₁ + … + wₙxₙ) ÷ (w₁ + … + wₙ) = x̄
(ii) Find the approximate number and share of payload objects and other objects in the year 2025.
(iii) What can you say about the number of payload objects over time, and the number of other objects over time? What can you say about the share of payload objects over time, and the share of other objects over time?
(i) About 10,000 objects in 2003. The total reached about 20,000 (double) in about 2021; it passes 20,000 between 2021 and 2022.
(ii) In 2025 the total is about 33,000: payload ≈ 17,000 (about 51%) and other objects ≈ 16,000 (about 49%), roughly half each.
(iii) Both numbers only increase, since the chart is cumulative. Payload objects grew slowly until about 2019 (about 4,000) and then shot up to about 18,000 by 2026. Other objects grew steadily, with jumps around 2007 and 2009, and kept rising after that.
For decades payload objects were only about one-fifth to one-quarter of the total; since 2019 their share has risen sharply to about half, so the share of other objects has fallen from about three-quarters to about half.
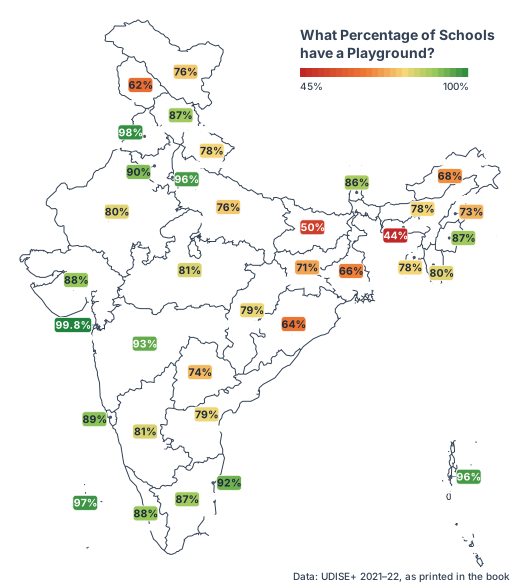
(a) More schools have a playground in Haryana compared to Uttarakhand.
(b) Approximately every 2 out of 3 schools in Arunachal Pradesh have a playground.
(c) Punjab has the highest number of schools with a playground.
(d) Suppose it is given that Maharashtra has more schools than Telangana. Then the number of schools having a playground is more in Maharashtra.
(ii) Using the information given, can we find the nation-wide percentage of schools with a playground? If not, what additional information is needed?
(i) Correct: (b) and (d).
(a) Not correct: Haryana has a higher percentage (90% vs 78%), but we do not know how many schools each state has, so we cannot compare numbers.
(b) Correct: 68% ≈ 66.7% = 2/3.
(c) Not correct: the map gives percentages, not numbers. Punjab’s 98% is the highest among the states, but Dadra & Nagar Haveli and Daman & Diu shows 99.8%.
(d) Correct: Maharashtra has both a higher percentage (93% vs 74%) and more schools, so 93% of a larger number is more than 74% of a smaller number.
(ii) No. We need the number of schools in each State/UT. The national percentage is the weighted mean of the State/UT percentages, weighted by these numbers.
(i) Which of the plays would you choose to watch based on the following chart?
(i) Play A or Play B. Each has about 71% of ratings at 4★ or 5★ and only about 14% at 1★ or 2★. Play A has a slightly bigger 5★ share, so Play A looks a touch better. Play C has the largest 5★ share (about 40%) but also about one-third 1★ ratings, so it is risky: people either love it or hate it.
(ii) Yes, I would choose Play B. The stacked chart shows that Play B has about 925 ratings, Play A only about 210 and Play C about 380. Play B’s good shares come from many more people, so they are more reliable; it is also clearly the most popular.
| Swimming | Cycling | Running | |
|---|---|---|---|
| Athlete 1 | 01:08 | 05:00 | 03:15 |
| Athlete 2 | 01:05 | 05:10 | 03:35 |
| Athlete 3 | 01:22 | 05:55 | 03:50 |
(ii) Suppose a 100% stacked bar chart is drawn. Which of the following question(s) can be answered by looking at just that chart?
(a) Who finished the race first?
(b) Approximately what fraction of their race time did Athlete 1 spend cycling?
(c) Which athlete took the longest for running?
(i) A stacked bar chart. The race is decided by total time, and a stacked bar shows each athlete’s total as the bar length, while still showing the three segments.
Athlete 2 = 1:05 + 5:10 + 3:35 = 9 h 50 min
Athlete 3 = 1:22 + 5:55 + 3:50 = 11 h 07 min
(ii) Only (b): 300 ÷ 563 ≈ 0.53, a little more than half. (a) and (c) need actual times, which a 100% chart does not show.
I notice: seeing and movement disabilities form a bigger share as age increases (seeing about 18% → 25%, movement about 13% → 25%). Multiple disability is largest for 60 & above (about 12%). The shares of mental retardation (about 8% → 2%) and speech (about 9% → 4%) fall with age. Hearing stays about the same (18–20%).
Inferences: problems of eyesight, joints and walking become more common in old age, while conditions present from birth or childhood make up a larger part among the young.
I wonder: how many disabled persons are in each age group? These are only shares, so a falling share does not mean fewer people. What is included in “any other”, which is large for young people?
(i) Recall the previous day and fill in the approximate time spent lying down, sitting, and standing/moving around, etc. Ask at least 2 of your family members about their day and fill it in. Alternatively, you can choose to track just your own body-state for any one of the weekdays, Saturday, and Sunday. Visualise it using a stacked bar chart. Discuss with your class how you arrived at the estimated time spent in each state.
(ii) Visualise your family’s monthly expenditure using a 100% stacked bar chart.
(a) First, identify the expense categories in your family budget.
(b) Discuss with your family members to decide how you will collect and organise the data.
(c) Collect expense data for at least 3 months.
(d) Represent the data in a 100% stacked bar chart, with each bar showing how the total monthly expenditure is divided across the different categories.
(e) Finally, write your observations and inferences based on the chart.
Sample for (i): I went through the day in time blocks (sleep, school, travel, play, homework, meals) and put each block into one body-state. Each row must add to 24 h.
| Weekday (sample) | Lying down | Sitting | Standing/moving |
|---|---|---|---|
| Me | 9 h | 10 h | 5 h |
| Mother | 7 h | 6 h | 11 h |
| Father | 7 h | 11 h | 6 h |
Observation: I sit the most; my mother, who does most of the housework, moves the most; my father’s office job keeps him sitting.
(i) Discuss and arrive at 4–6 aspects to rate. For each aspect chosen, justify why it matters for an overall experience.
(ii) Discuss and decide the relative weights and justify.
(iii) Collect or imagine ratings from at least 10 people on a scale of 1–5 (5 being very good).
(iv) Compute each individual rating. Compute the overall average across individuals.
(v) Make a 100% stacked bar chart using your data.
(vi) Write a short note on the observations and inferences, what your rating system captures well and what it misses.
Sample: (b) travel in a city bus.
| Aspect | Why it matters | Weight |
|---|---|---|
| Punctuality | people plan their day around the bus | 3 |
| Safety | driving and crowding affect passengers | 3 |
| Cleanliness | affects health and comfort | 2 |
| Comfort | seats, fans, crowding | 1 |
| Staff behaviour | politeness and help | 1 |
(iv) Person 1 rated 3, 4, 2, 3, 4: rating = (3×3 + 4×3 + 2×2 + 3×1 + 4×1) ÷ 10 = 32 ÷ 10 = 3.2. The ten individual ratings were 3.2, 3.8, 2.4, 3.8, 3.2, 4.0, 2.4, 3.4, 4.5, 3.2, so the overall average = 33.9 ÷ 10 = 3.39.
(v) For each aspect, the shares of 5★, 4★, 3★, 2★ and 1★ ratings make one 100% bar (for example, safety: 20% gave 5★, 60% gave 4★, 20% gave 3★).
(vi) The bus scores well on staff behaviour and safety but poorly on cleanliness. The scheme stresses what matters most, but it misses things like fare, frequency and crowding at peak hours.
Method: for each family, multiply its average age by its number of members to get the family’s total age. Add these totals for all families and divide by the total number of family members.
Sample (5 families): (38.5 yr, 4), (31 yr, 3), (42 yr, 6), (29.4 yr, 5), (35 yr, 4).
Total members = 22
Average age = 786 ÷ 22 ≈ 35.7 years
In general it changes: it moves towards the ordinary (unweighted) average.
Experiment: values 10, 20 with weights 1, 3 give 70 ÷ 4 = 17.5. With weights 2, 4 they give 100 ÷ 6 ≈ 16.67, closer to the simple average 15.
New mean = Σ(wᵢ + 1)xᵢ ÷ Σ(wᵢ + 1)
= (Σwᵢxᵢ + Σxᵢ) ÷ (W + n)
= (W·x̄ + n·m) ÷ (W + n)
So the new value is a weighted mean of x̄ and m. It lies between them and is unchanged only when x̄ = m (for example, when all weights were already equal).
(i) % of cows decreased, % of sheep decreased, % of chickens decreased
(ii) % of cows increased, % of sheep increased, % of chickens increased
(iii) % of cows remained the same, % of sheep remained the same, % of chickens remained the same
(iv) % of cows decreased, % of sheep increased, % of chickens remained the same
(v) % of cows increased, % of sheep increased, % of chickens decreased.
Possible: (iii), (iv) and (v). Not possible: (i) and (ii).
The three shares must always add to 100%, so they cannot all fall or all rise.
Examples, with last year 120 cows, 50 sheep, 30 chickens (60%, 25%, 15%):
| This year (all fewer) | Shares | |
|---|---|---|
| (iii) | 60, 25, 15 | 60%, 25%, 15% |
| (iv) | 55, 30, 15 | 55%, 30%, 15% |
| (v) | 62, 28, 10 | 62%, 28%, 10% |
Chapter 10 of 14 – Maths
- Previous: Chapter 9 Propositions and their Converses
- Next: Chapter 11 The World of Algorithms
- All chapters: NCERT Solutions Class 9 Maths
Also for This Chapter
NCERT Solutions Class 9 Maths Chapter 10 How Quantities Combine: Understanding Data – Overview
| Class | Class 9 |
| Subject | Maths |
| Chapter | 10 – How Quantities Combine: Understanding Data |
| Textbook pages | Part II, 8 – 36 |
| Questions solved | 60 |
| Session | 2027 |
| Format | Full answers on this page + PDF |
NCERT Solutions Class 9 Maths Chapter 10 – FAQs
Where can I download NCERT Solutions Class 9 Maths Chapter 10 How Quantities Combine: Understanding Data PDF?
Read every answer on this page, or download the free PDF from the table at the top.
Is this for the 2027 session?
Yes, it follows the latest NCERT Class 9 Maths book for 2027.
How many questions are solved in NCERT Class 9 Maths Chapter 10?
All 60 questions of the chapter (textbook pages Part II, 8 – 36) – the in-text questions, activities and the end-of-chapter exercises.
How should I use these solutions?
Read the chapter in the NCERT book first, attempt the questions yourself, then check your answers here.