Download Connecting the Dots… – NCERT Class 7 Maths Chapter 13 PDF from the new NCERT Class 7 Maths book Ganita Prakash (2026-27). Read the chapter online or download the free PDF. A statistical question is one you answer by collecting data, because the answer varies. A statistical statement is a claim about that data, given as a number, a proportion or a prediction.
Connecting the Dots… PDF – Chapter 13 of Ganita Prakash (Part II)
Read the chapter online or download the PDF.
| Chapter | Download | |
|---|---|---|
| Chapter 13 PDF | Connecting the Dots… | View PDF |
| Full book | NCERT Class 7 Maths – Ganita Prakash | View Book |
Read Online

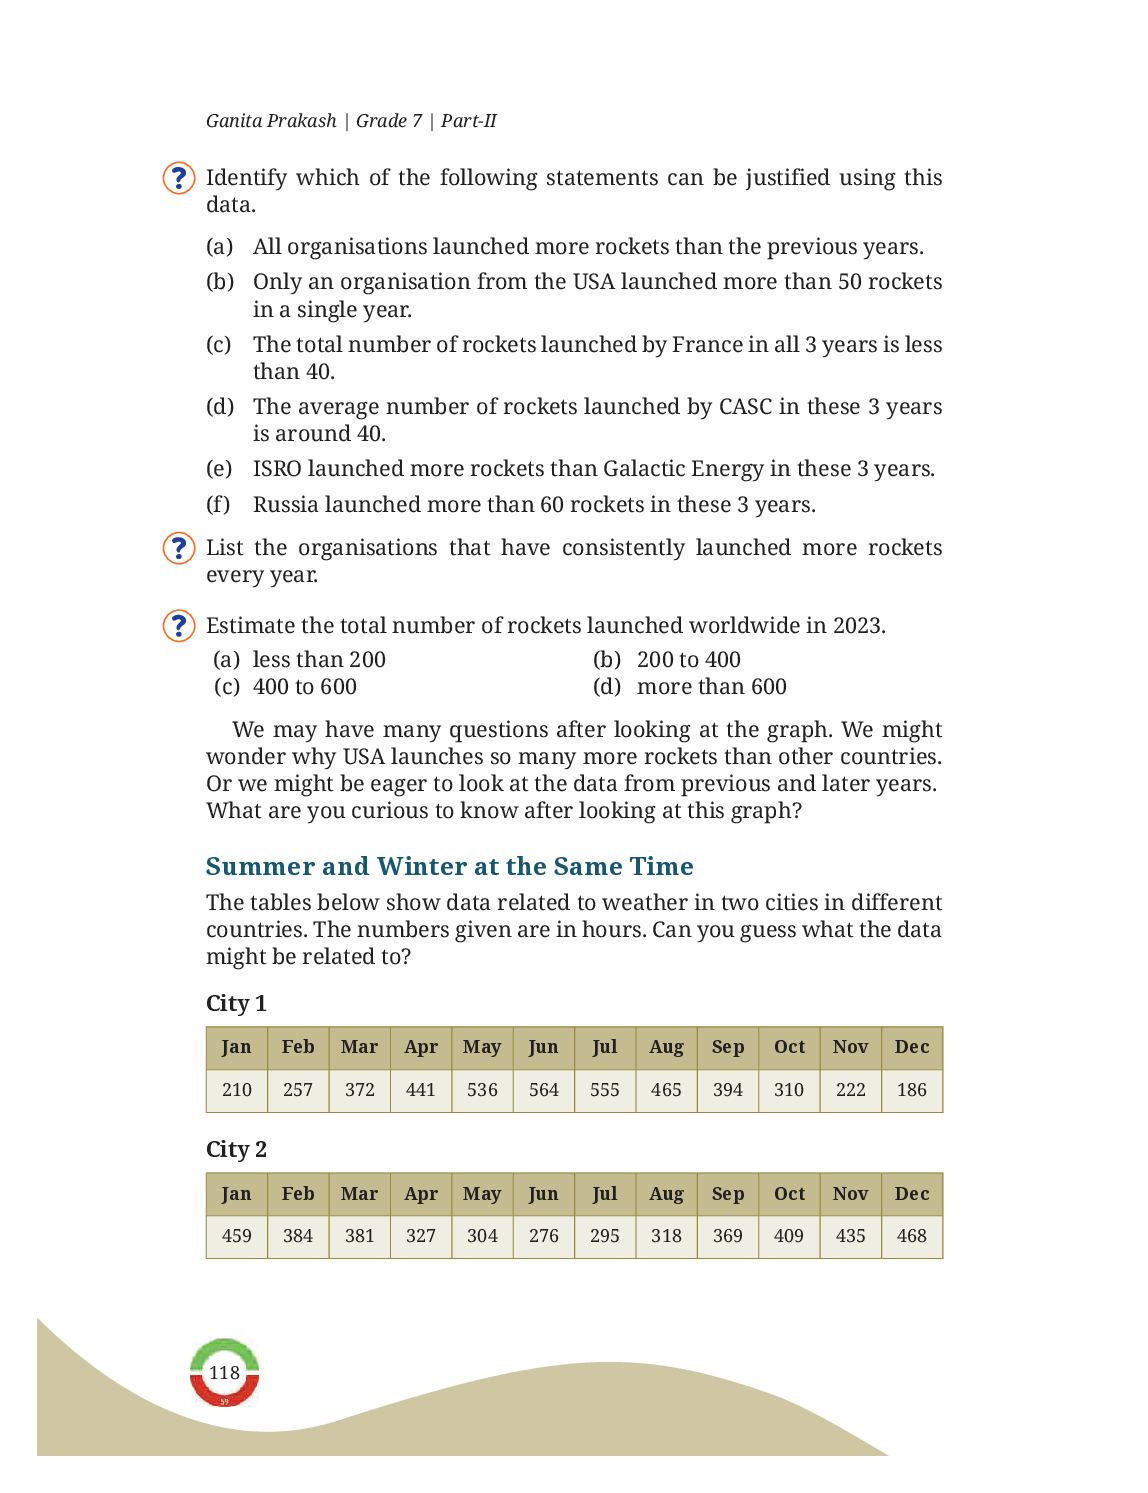
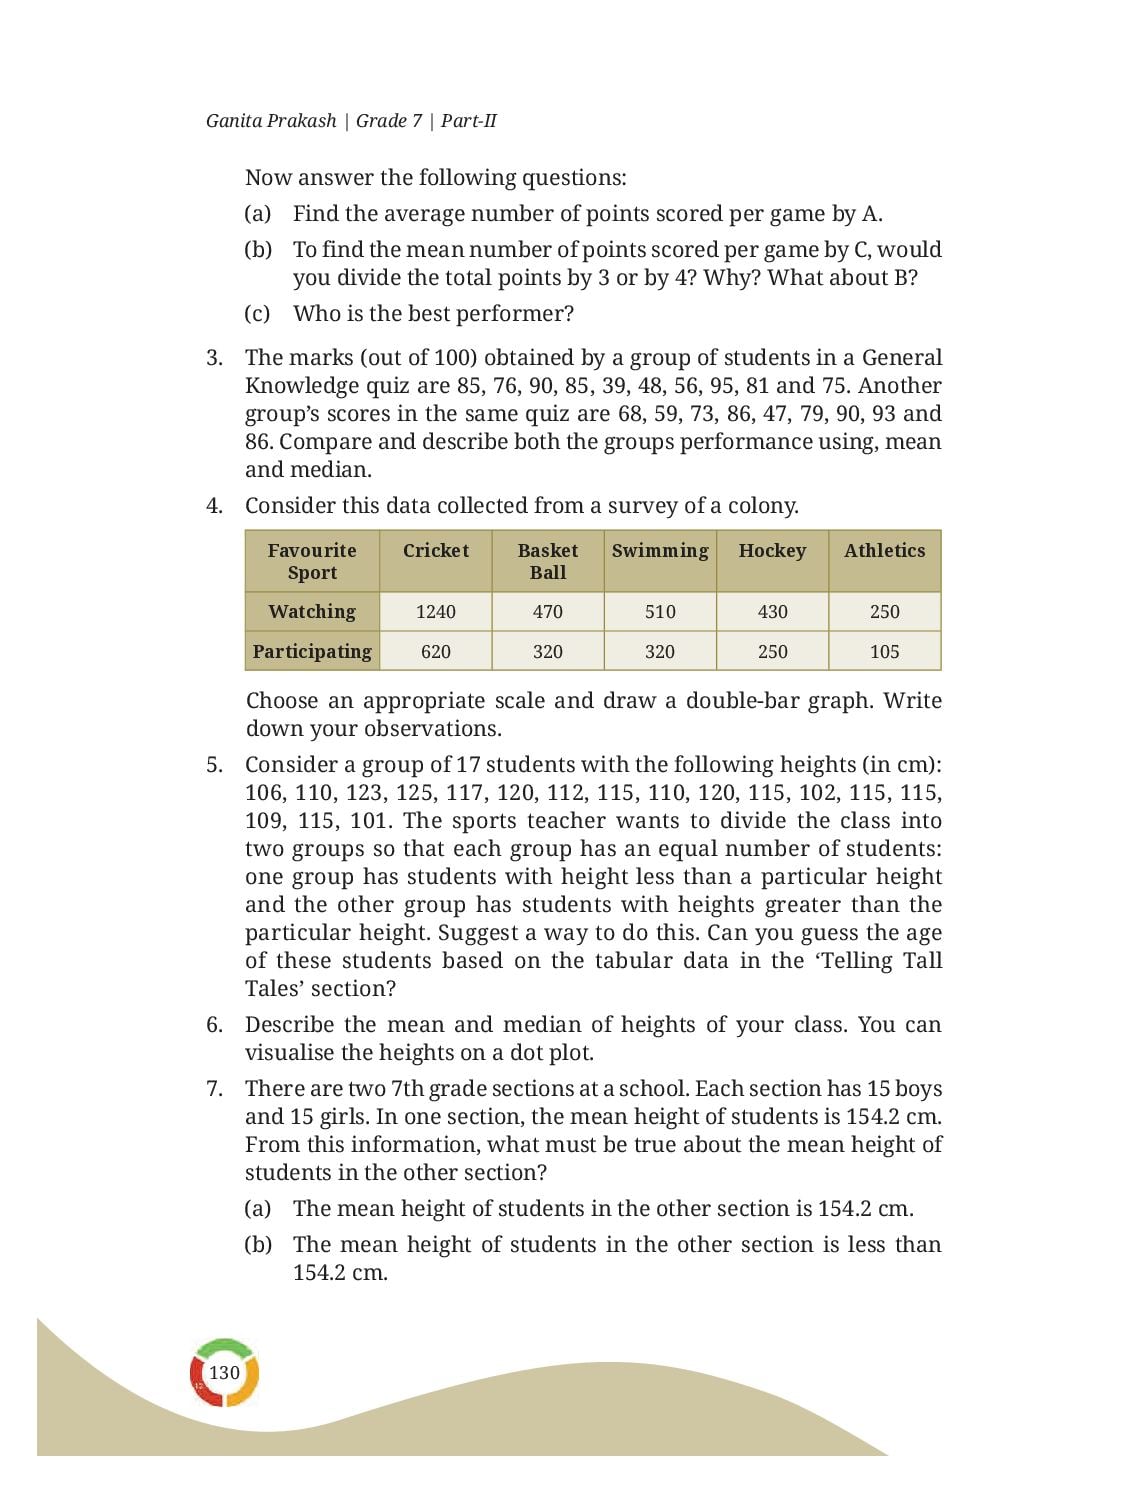
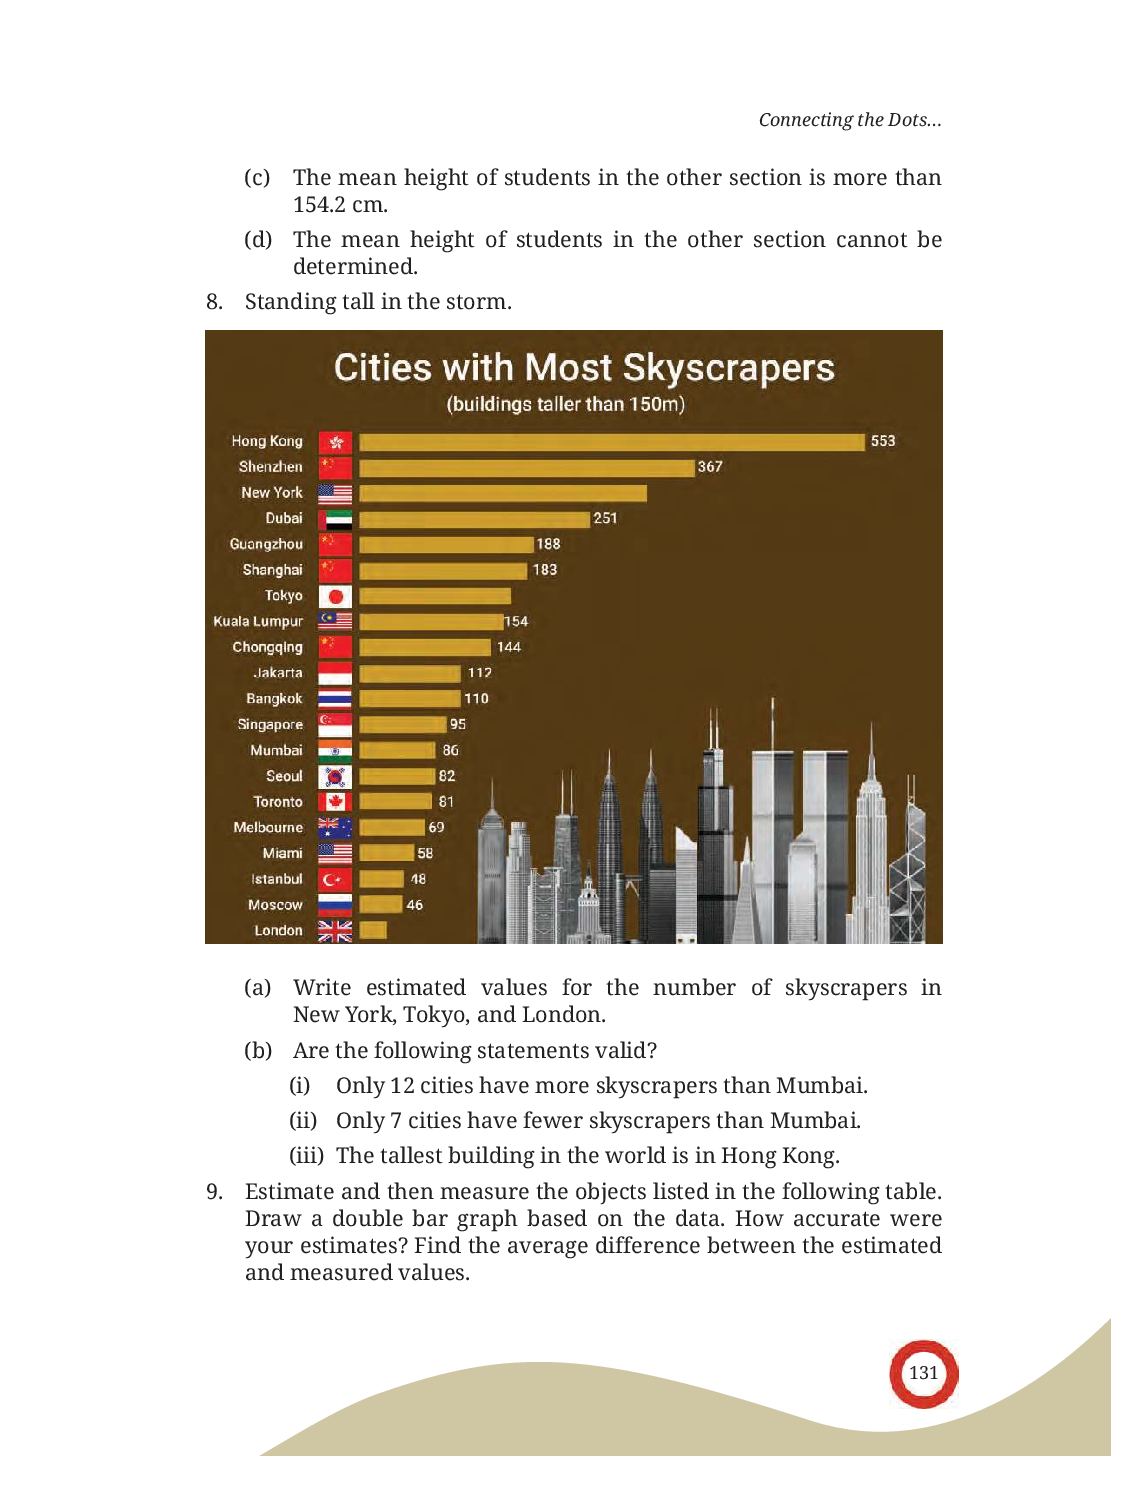
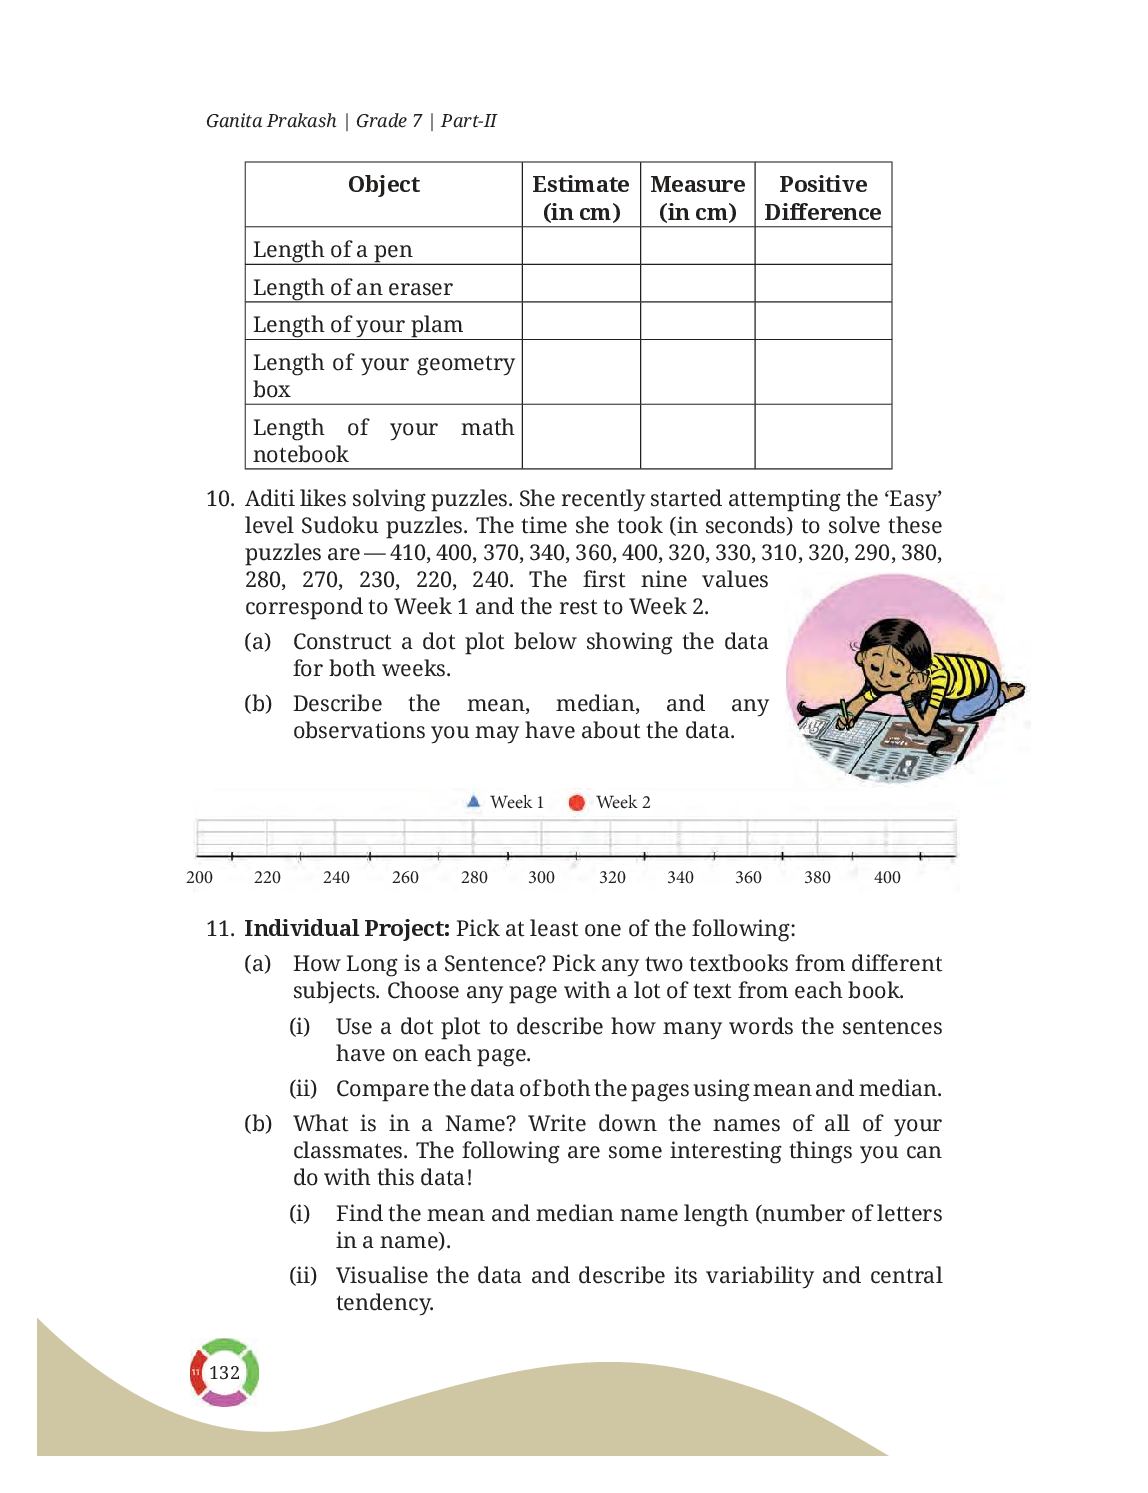
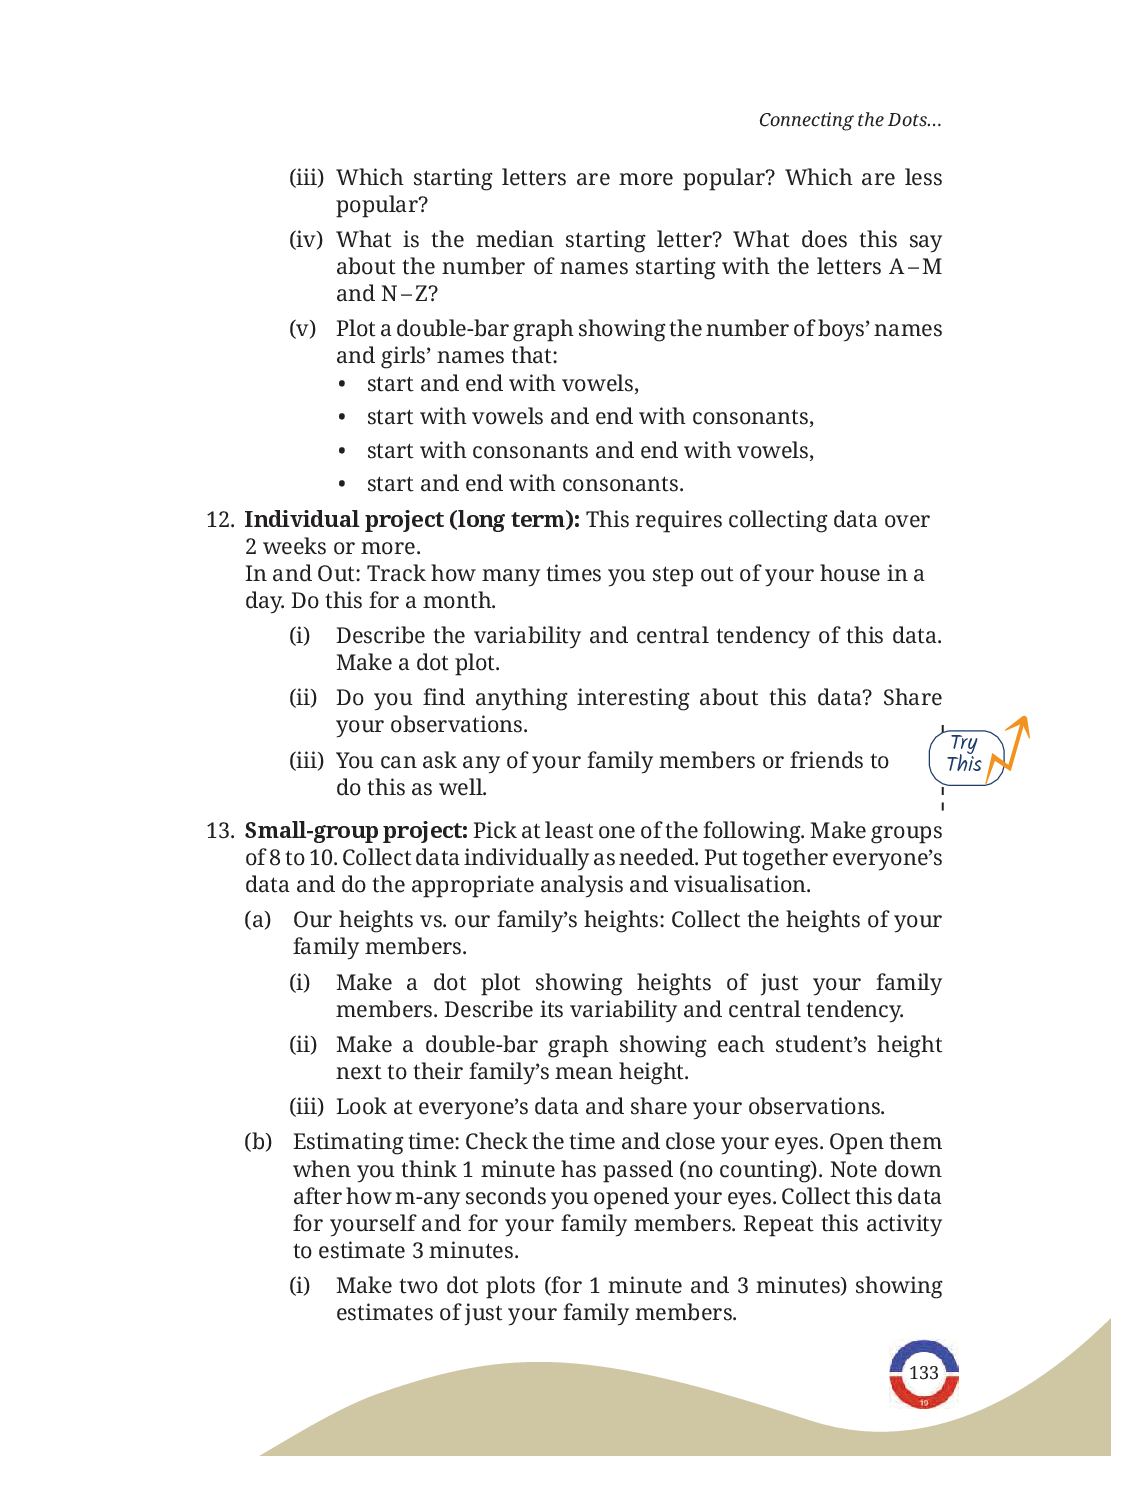
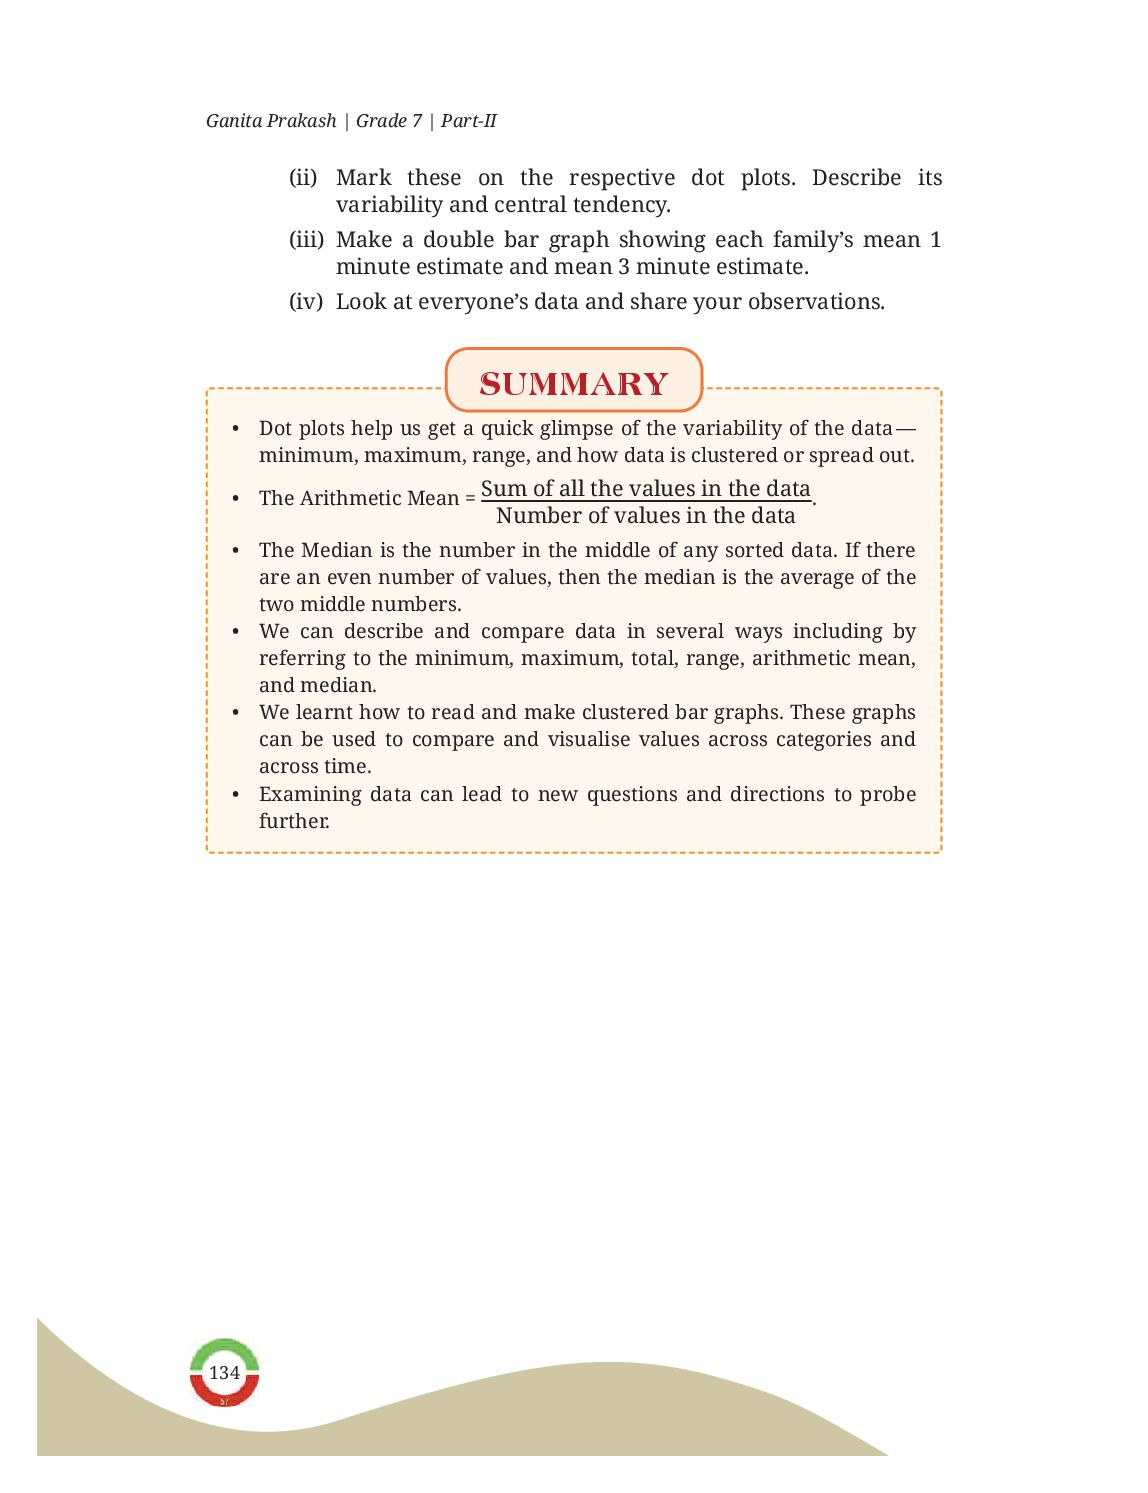
What Is in Connecting the Dots…? (Class 7 Maths Chapter 13)
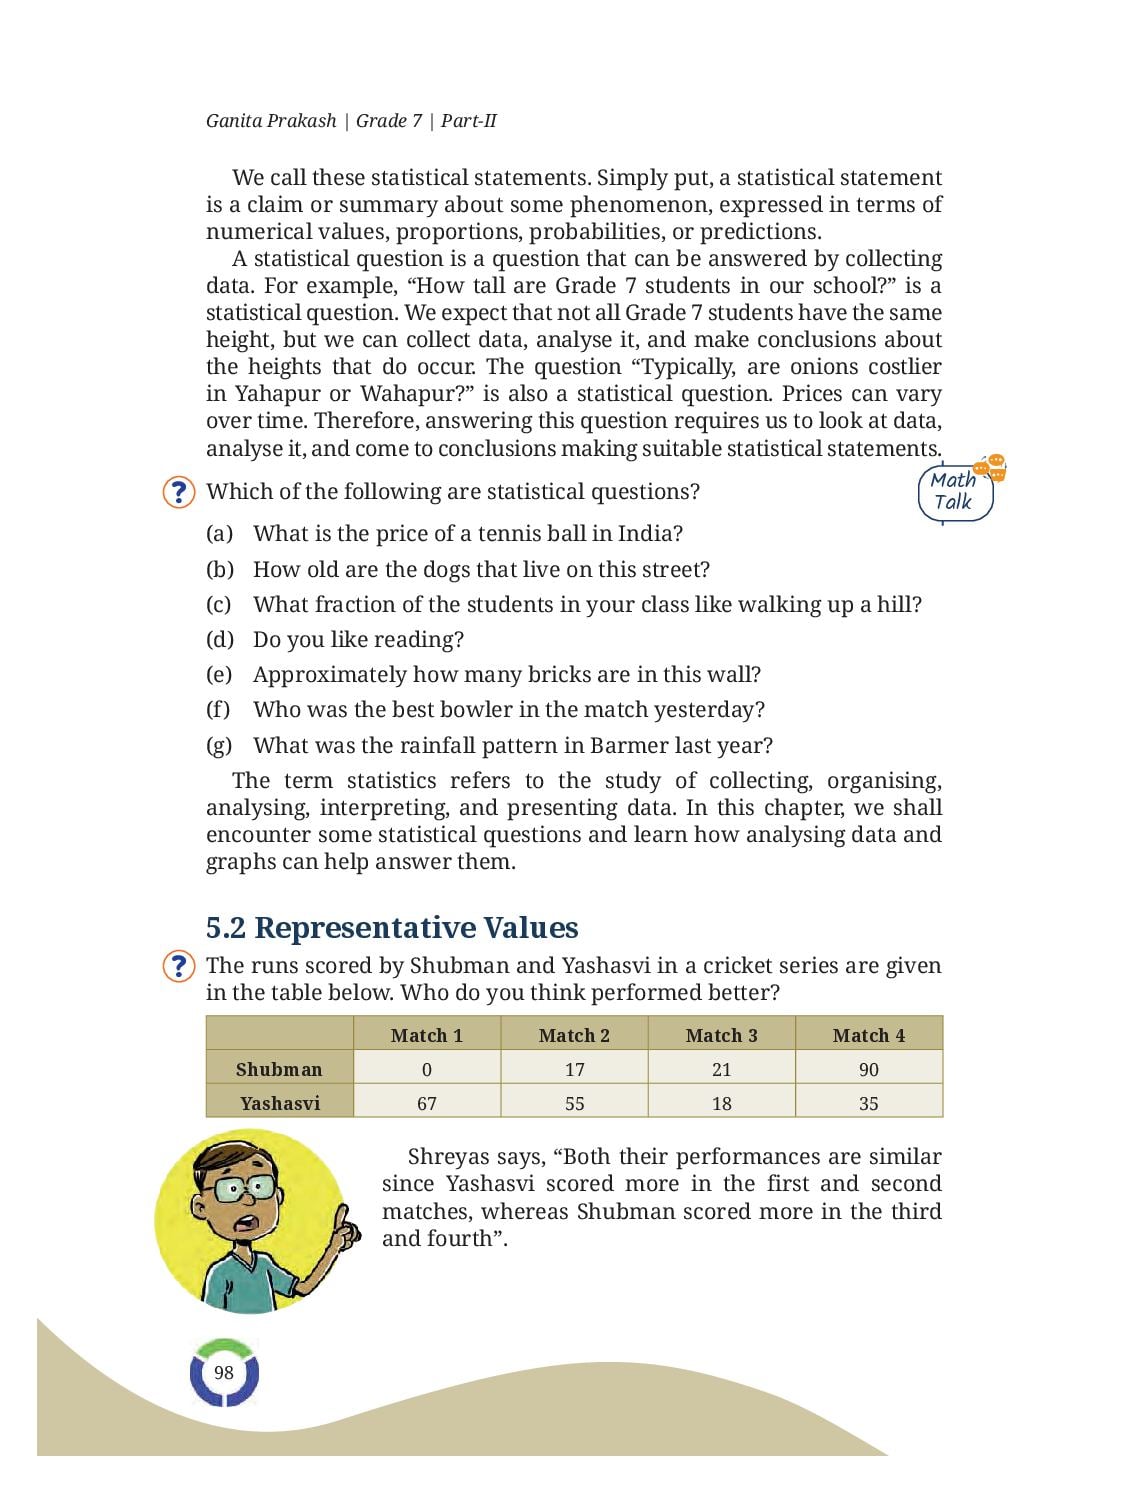
- A statistical question is one you answer by collecting data, because the answer varies. A statistical statement is a claim about that data, given as a number, a proportion or a prediction.
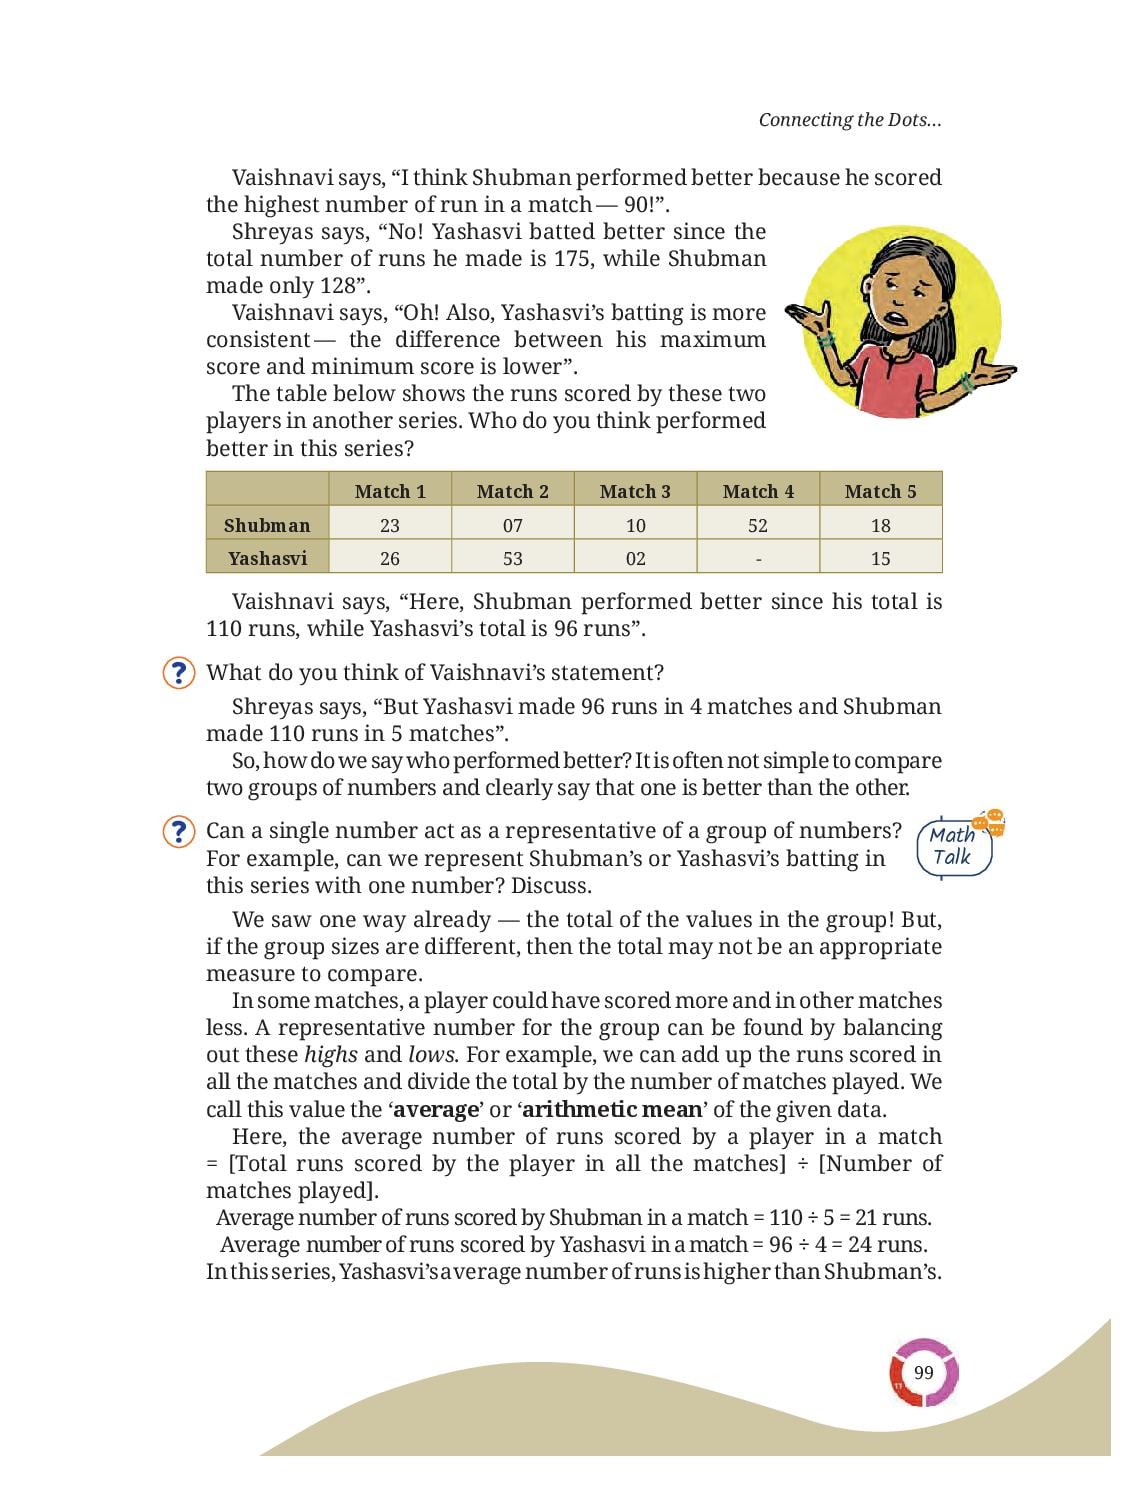
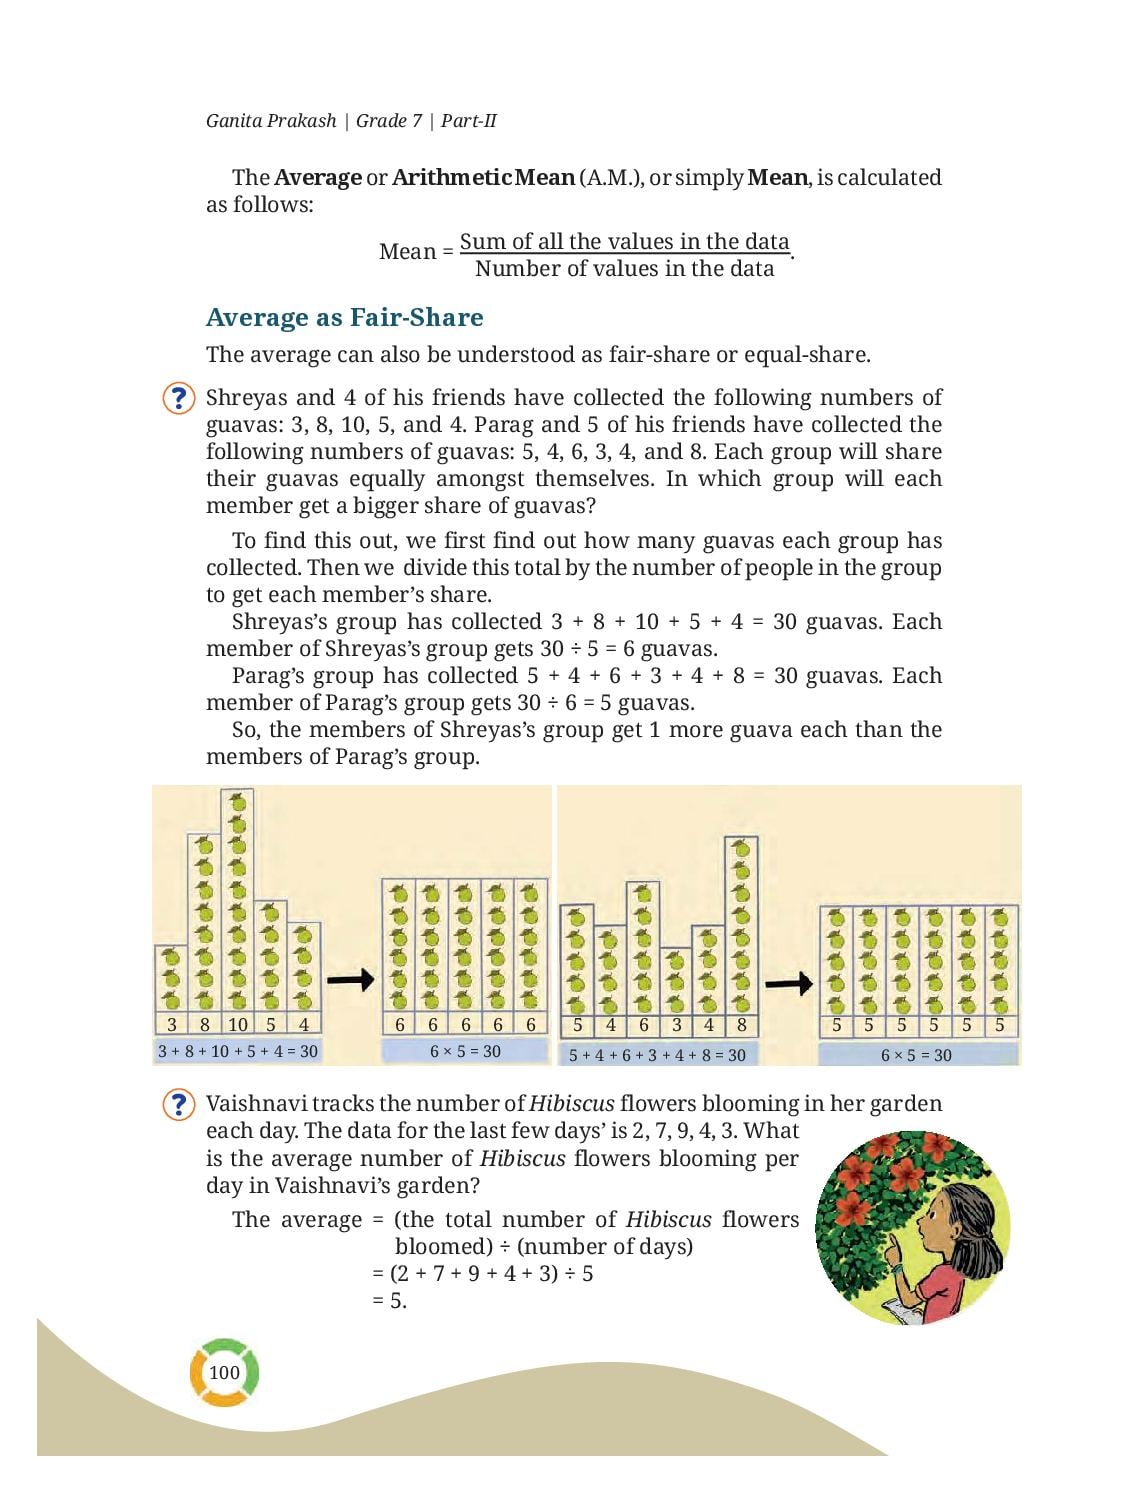
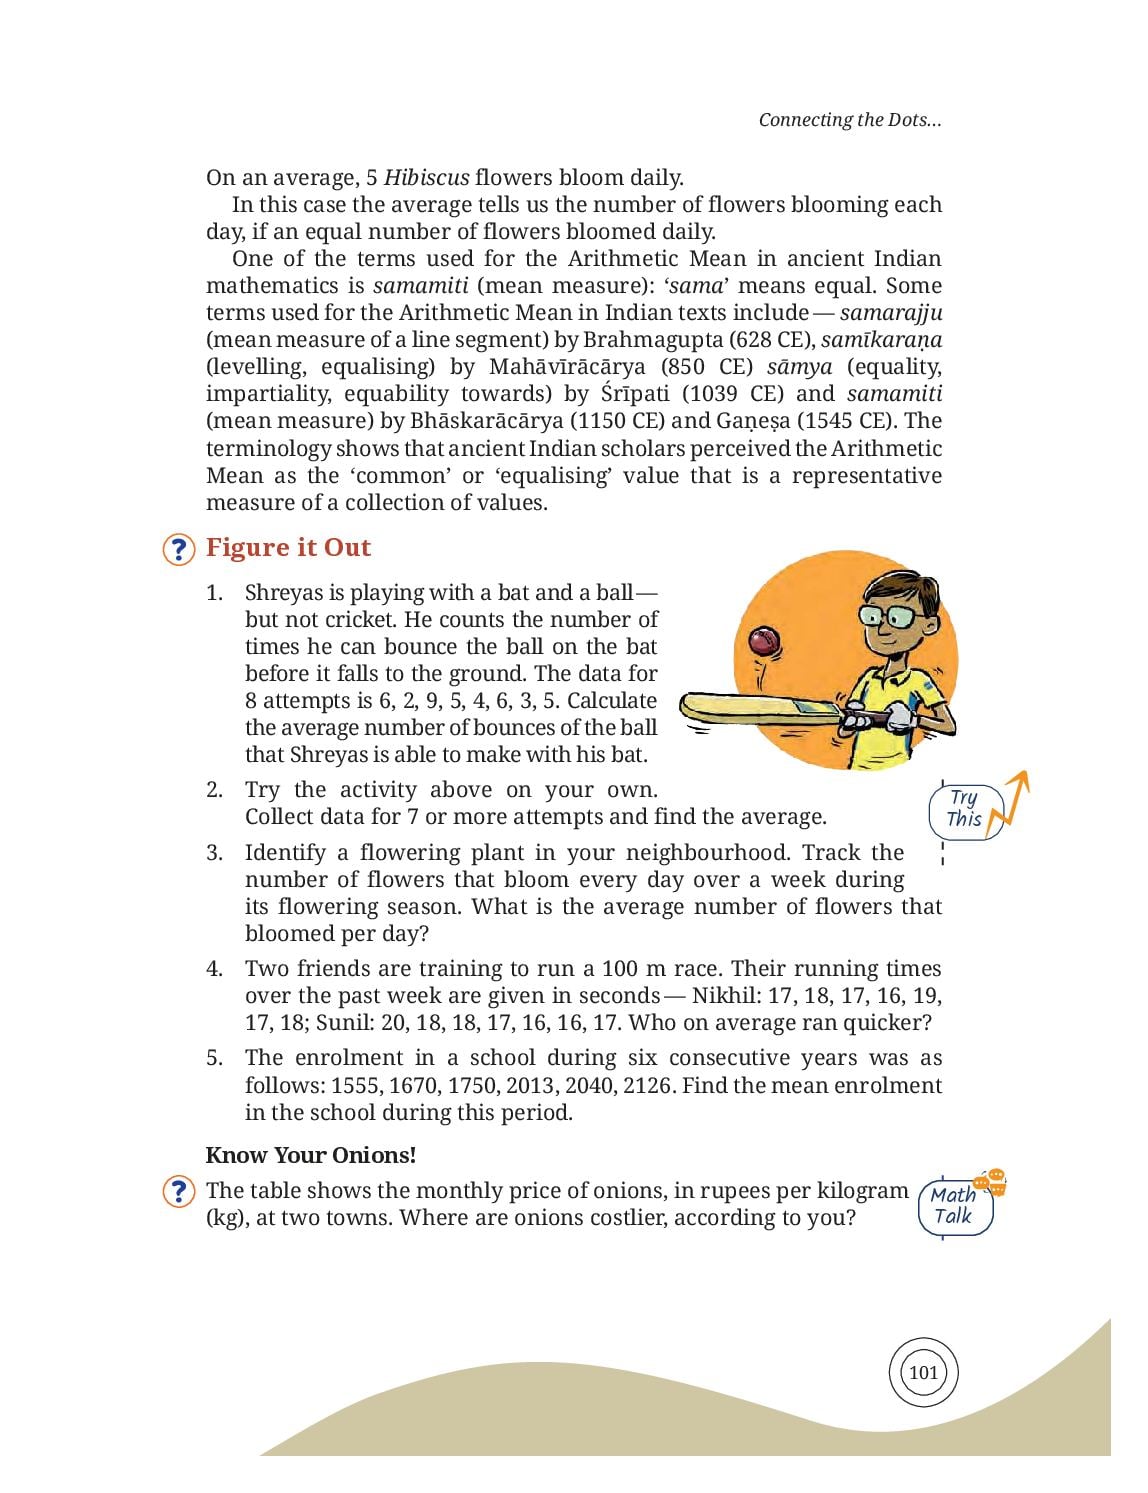
- Arithmetic Mean = (sum of all the values) ÷ (number of values). It is the fair share — the value everyone would get if the total were shared equally.
- Median = the middle value of the sorted data. With an even number of values, take the average of the two middle ones. Half the data lies at or above it.
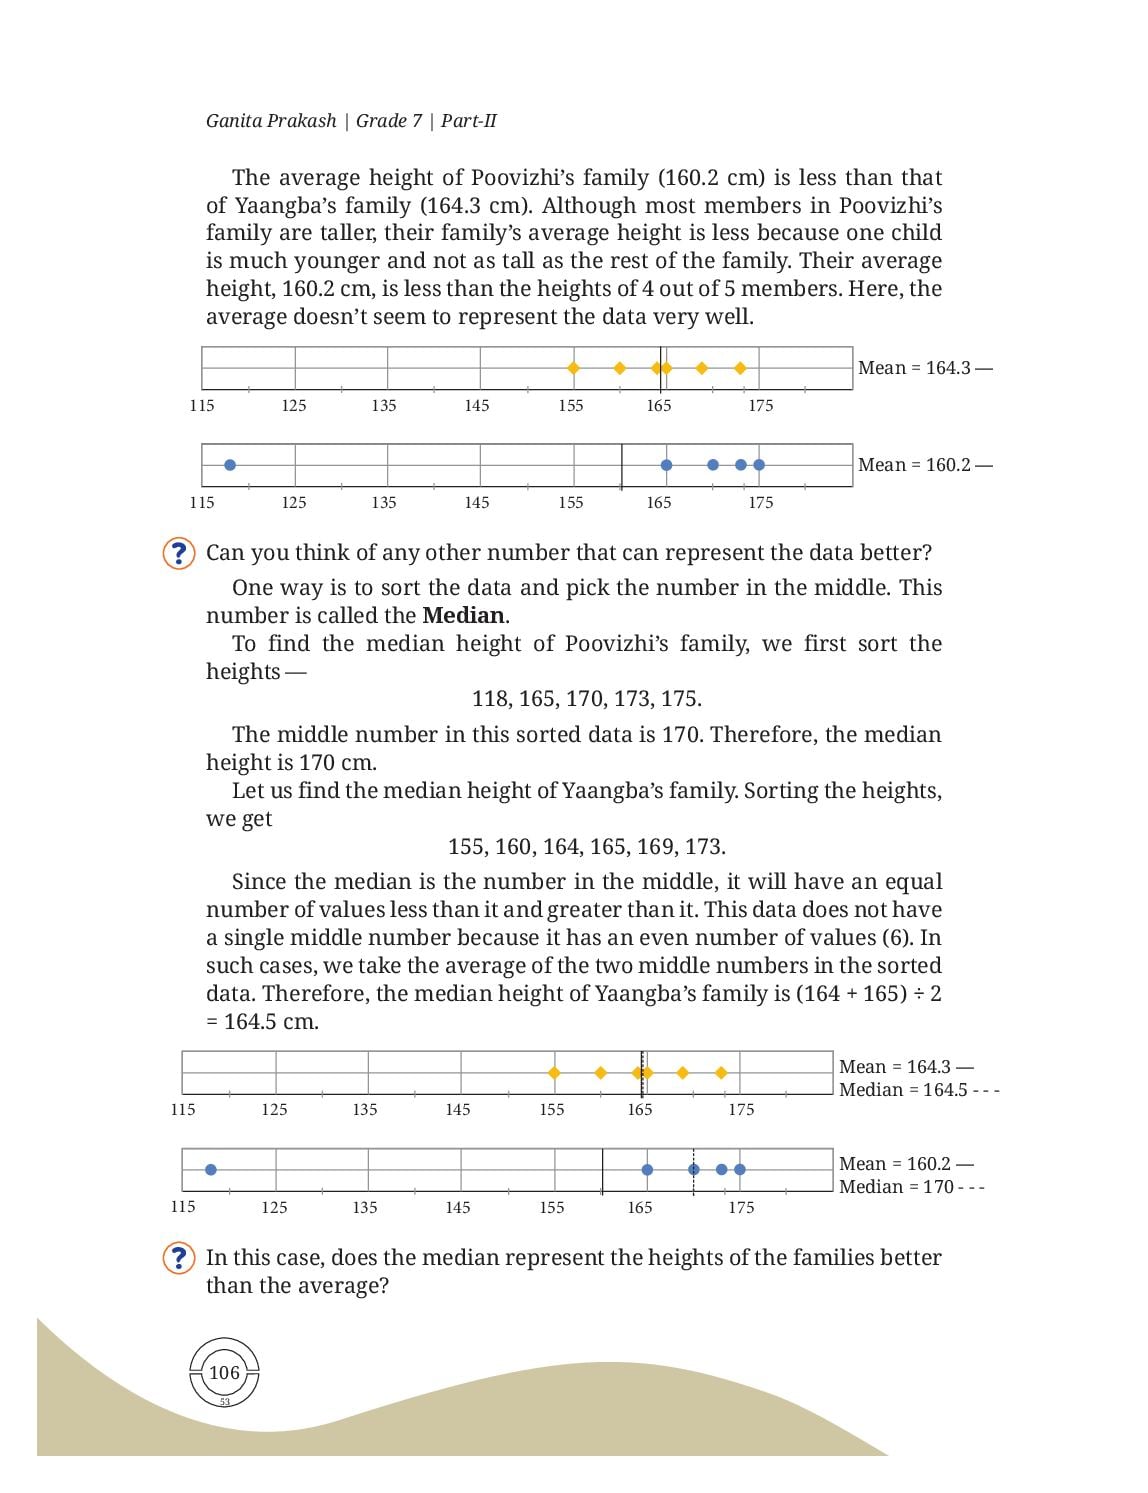
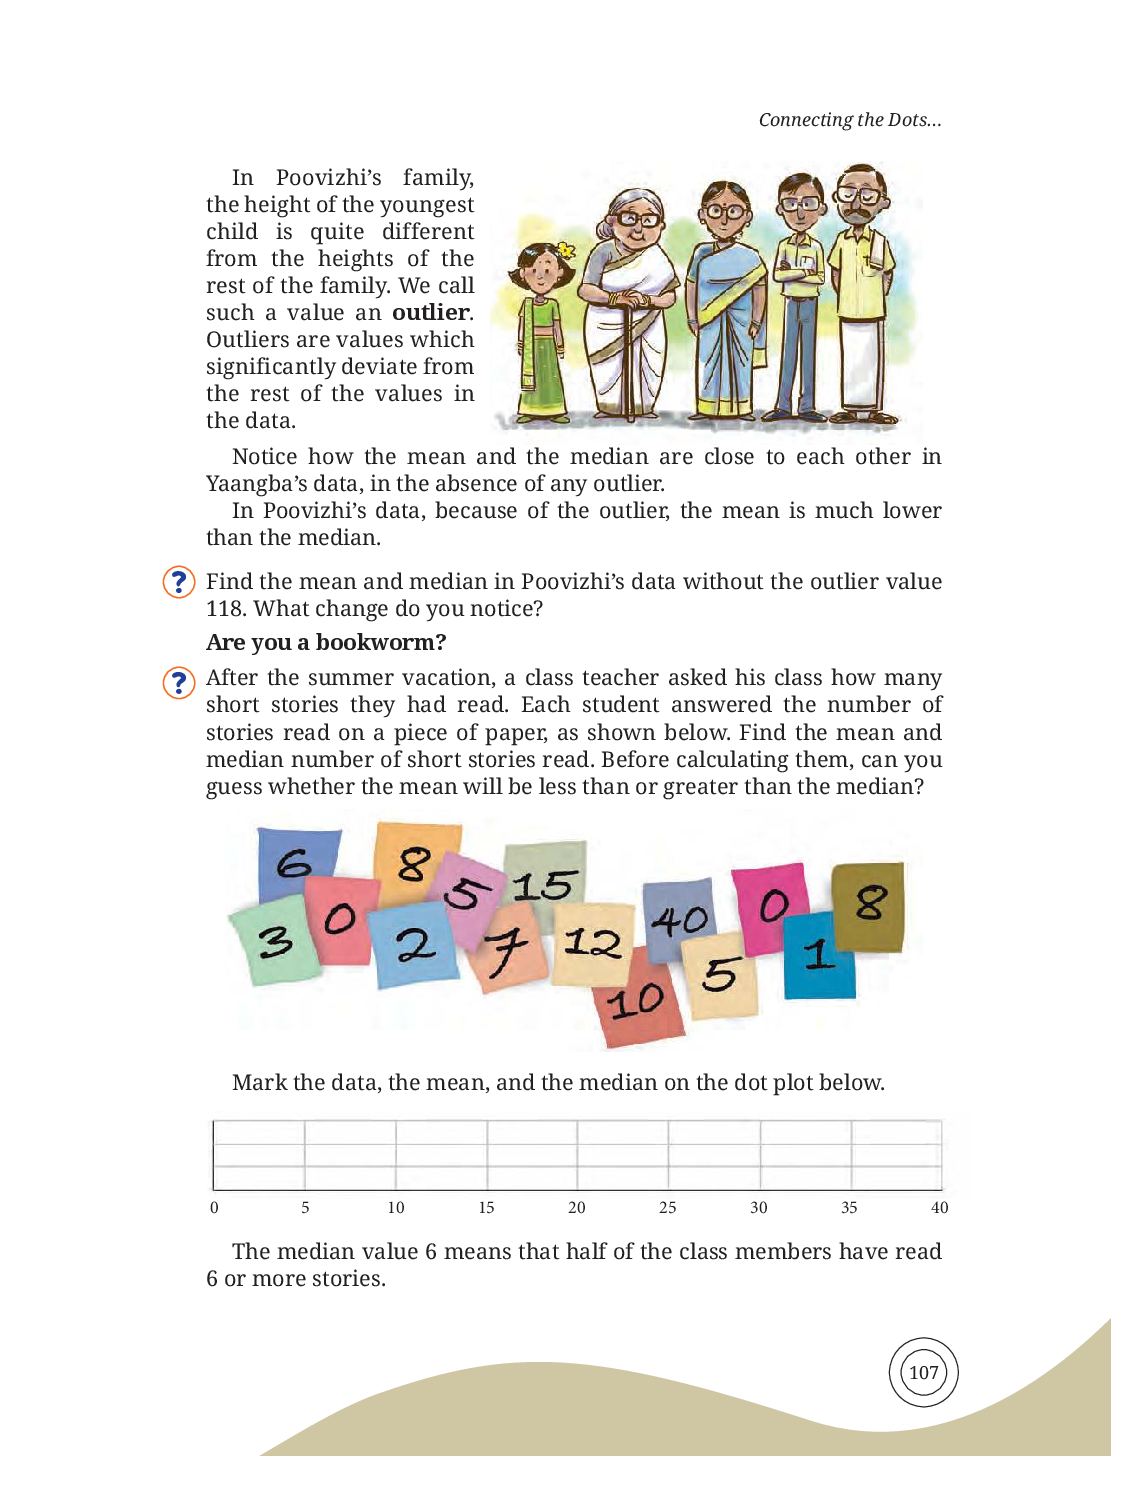
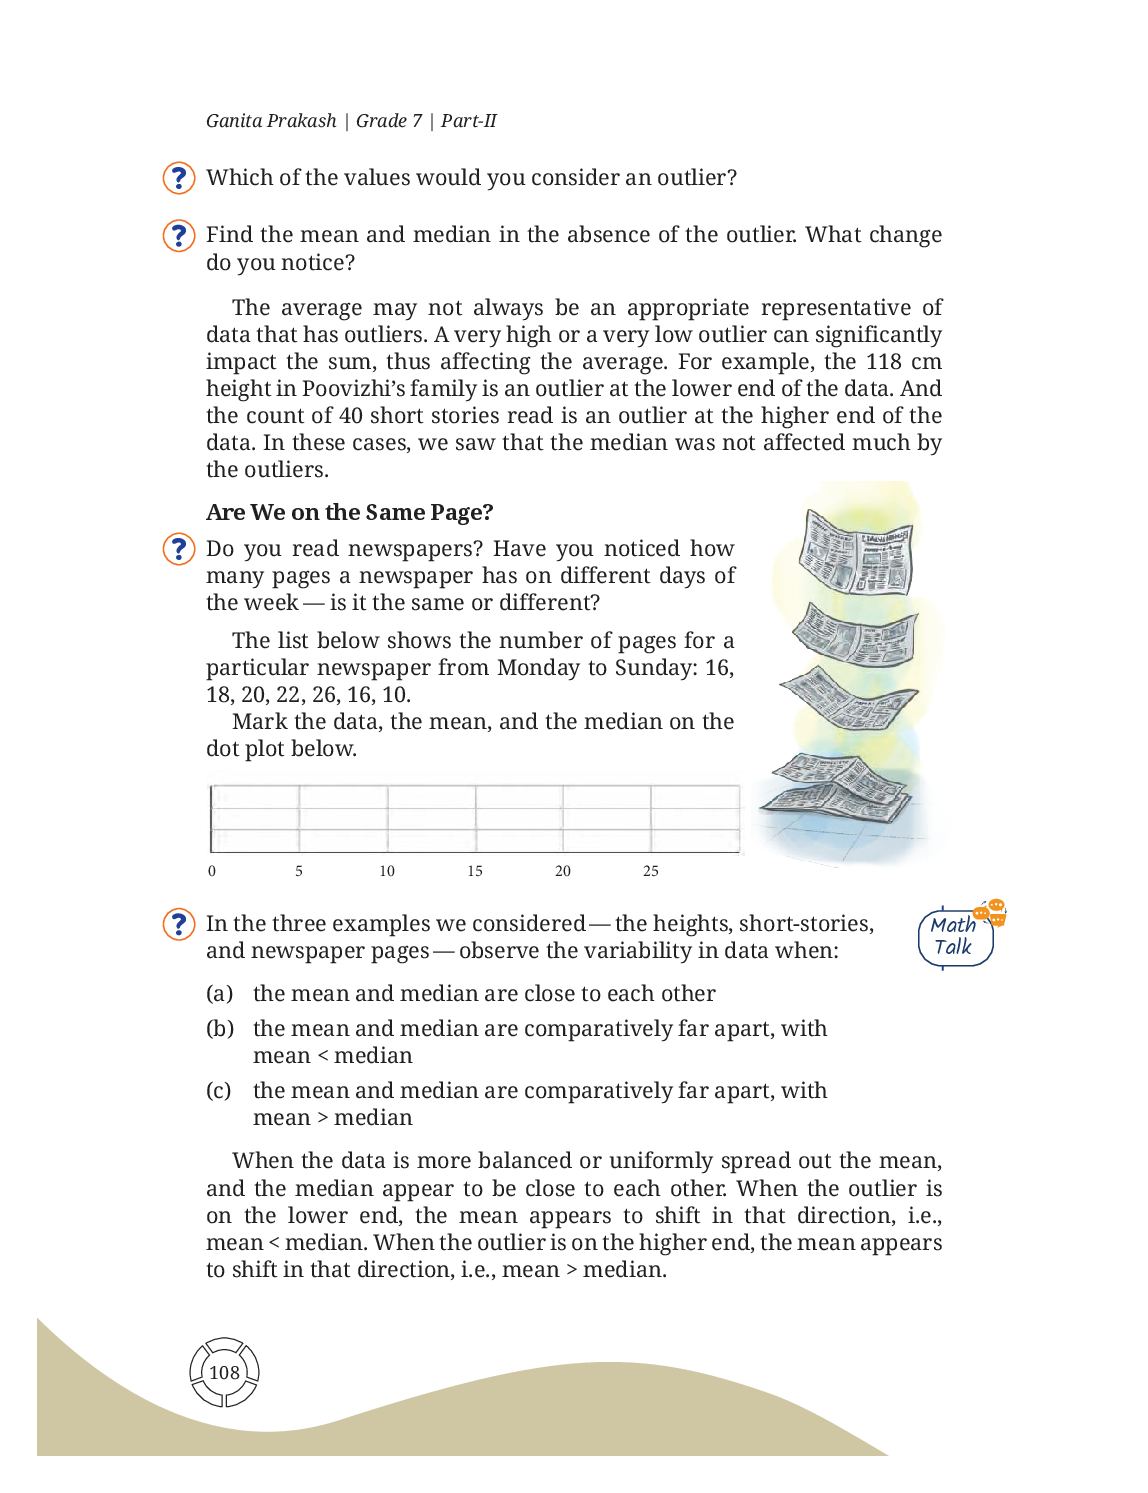
- An outlier is a value far away from the rest. It drags the mean towards itself but barely moves the median. Outlier low ⇒ mean < median; outlier high ⇒ mean > median.
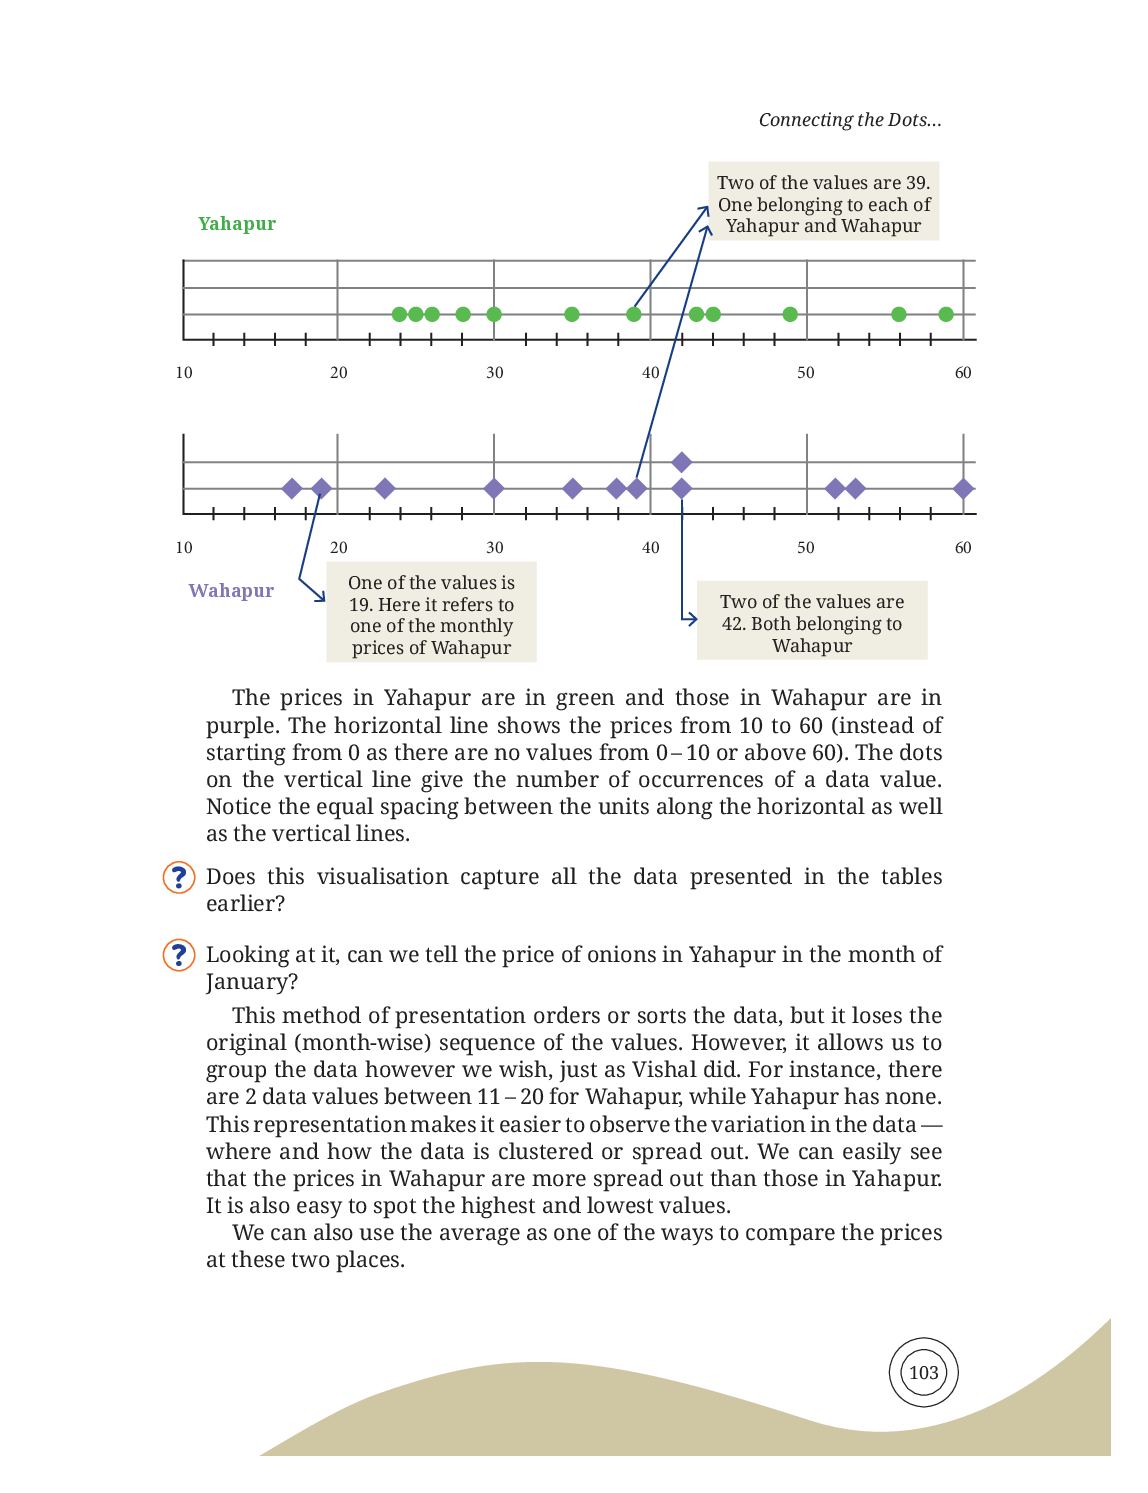
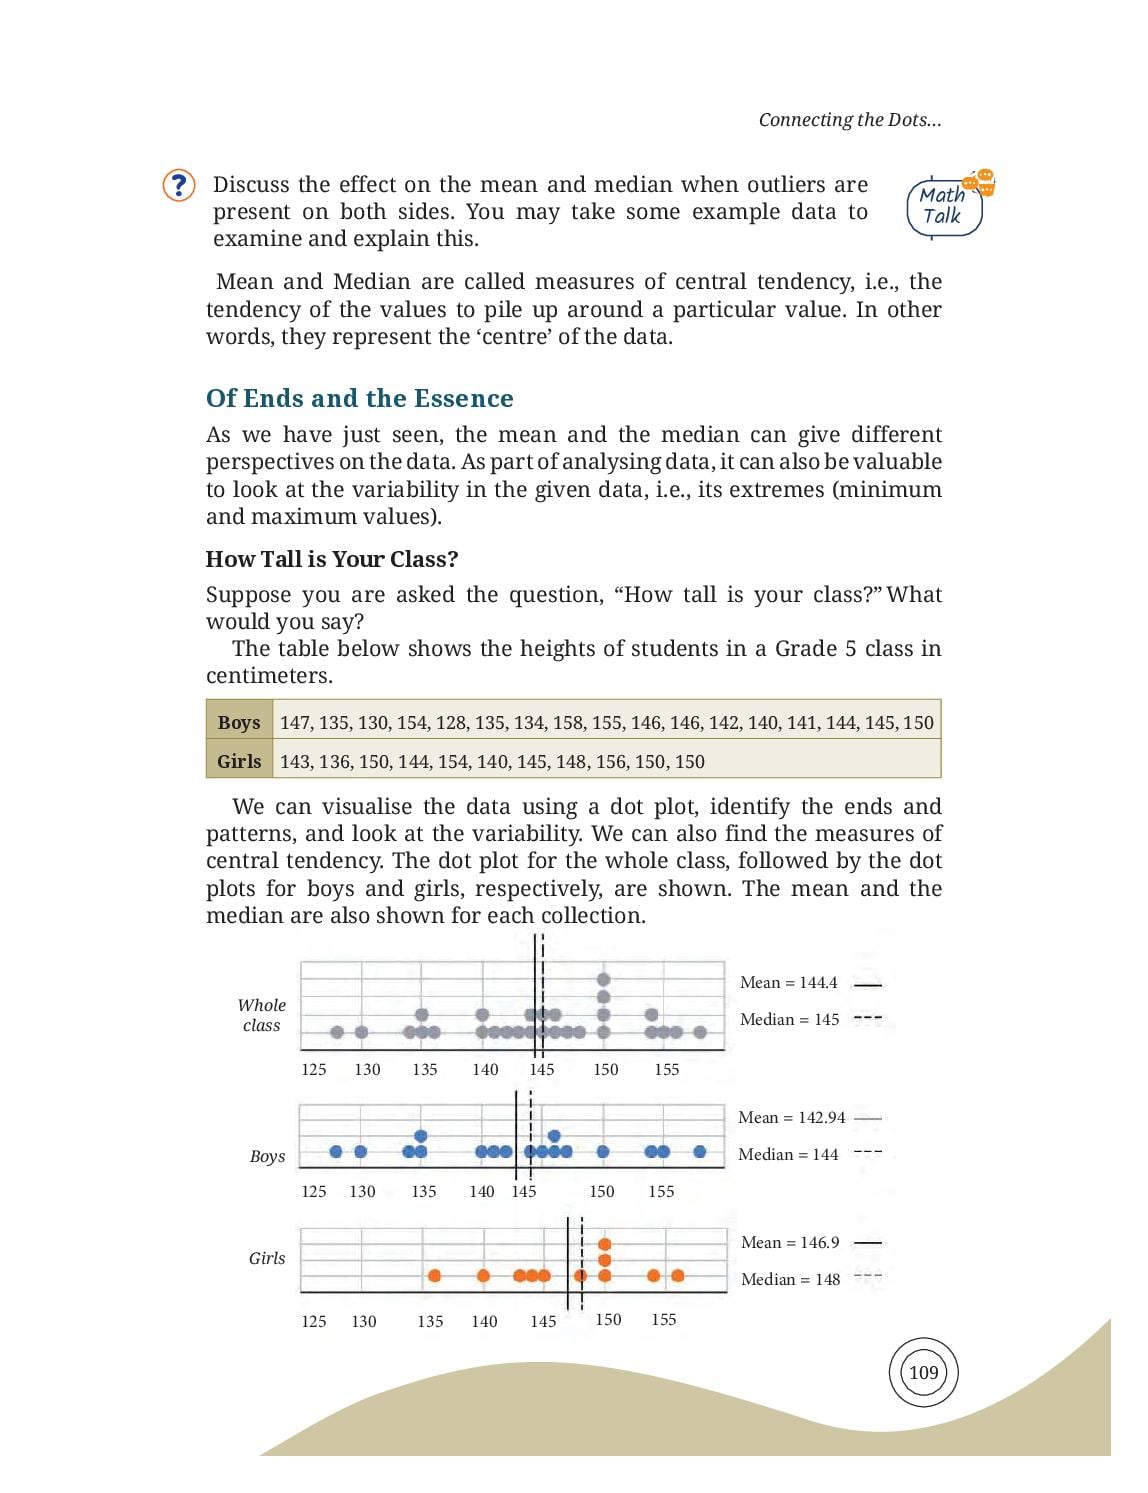
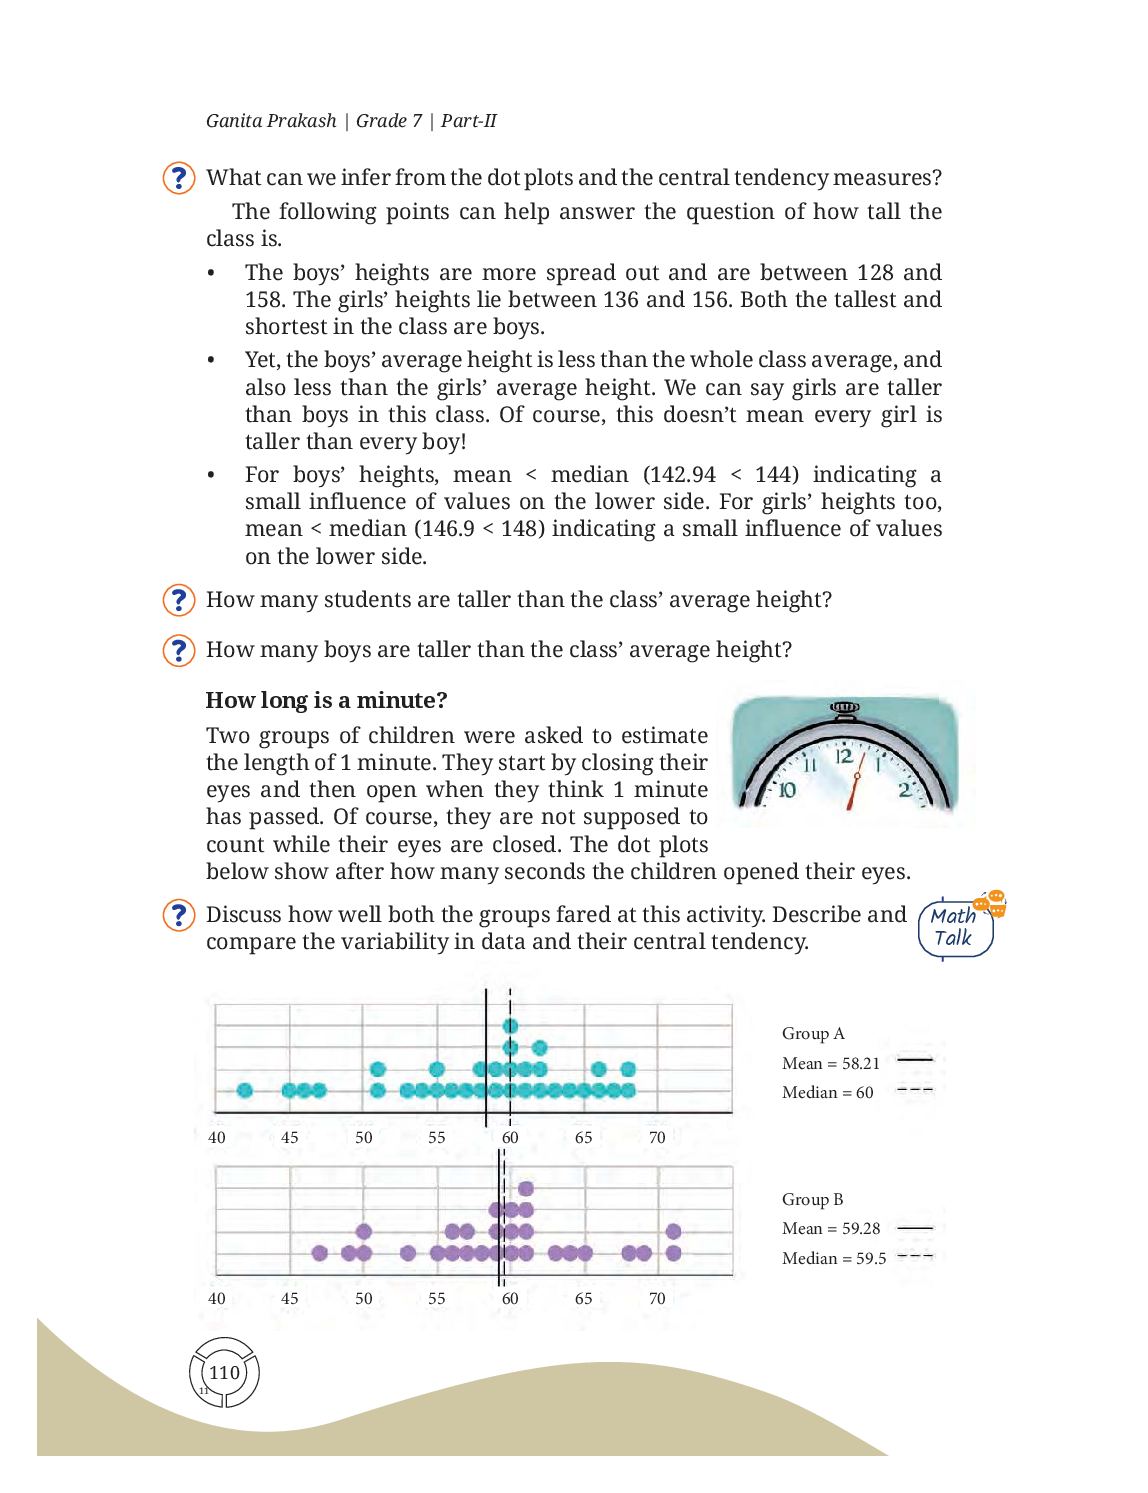
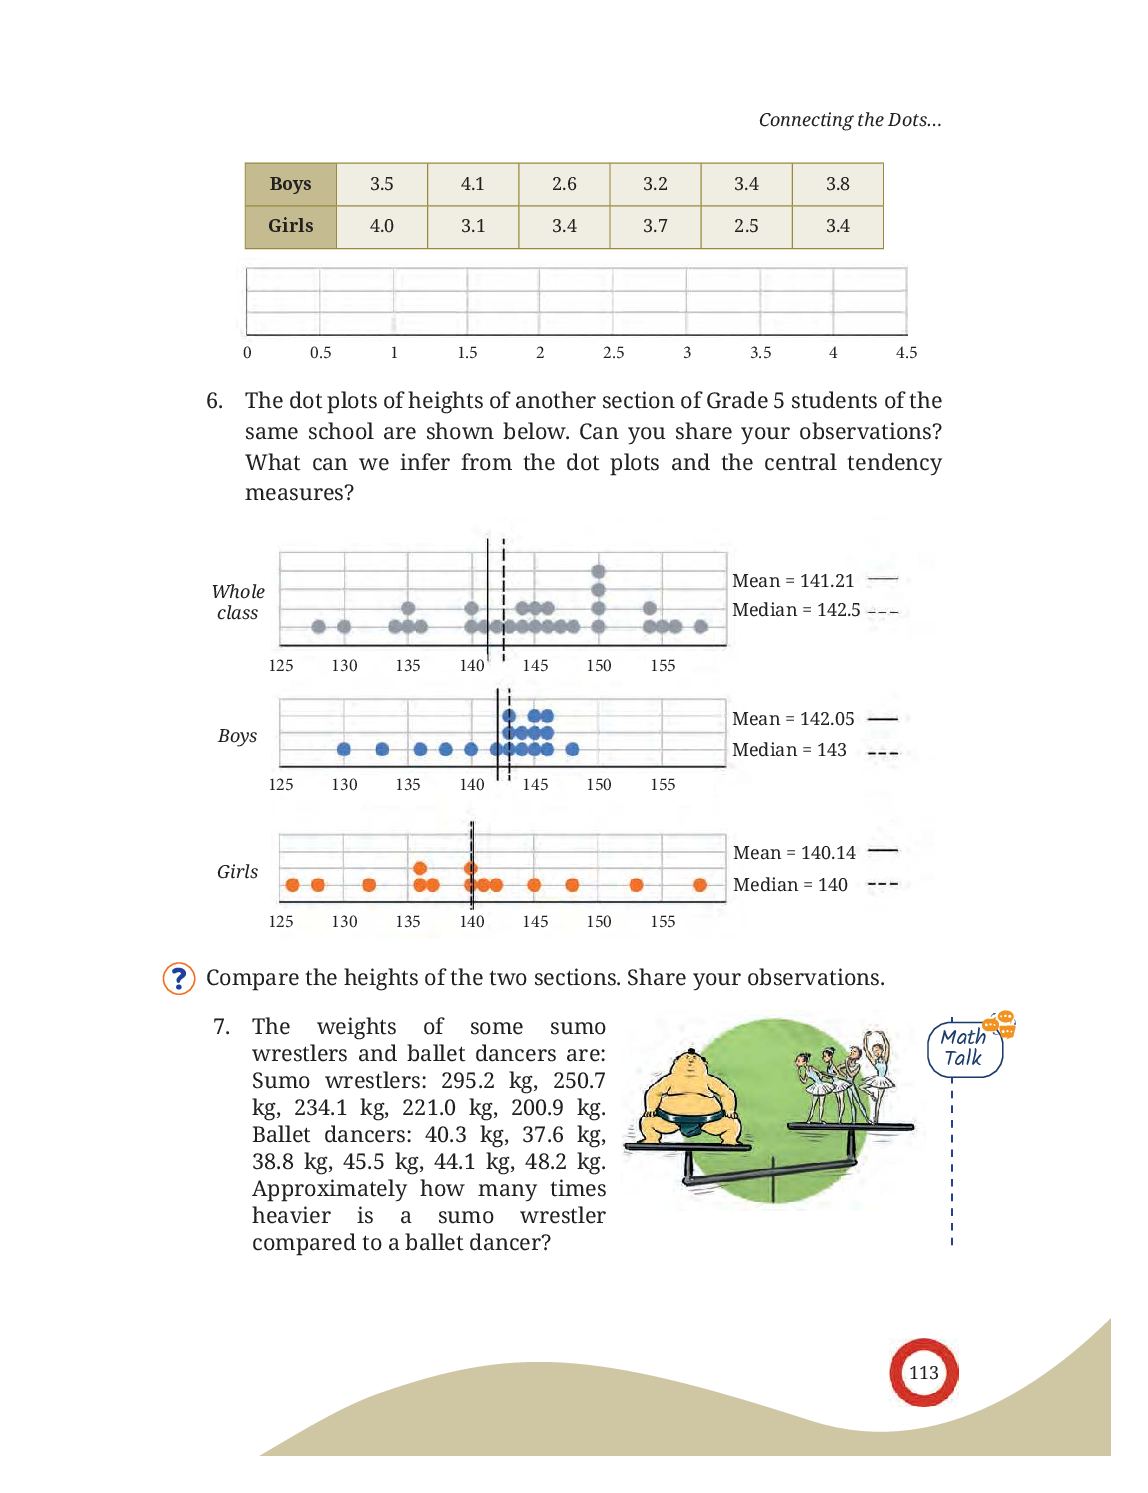
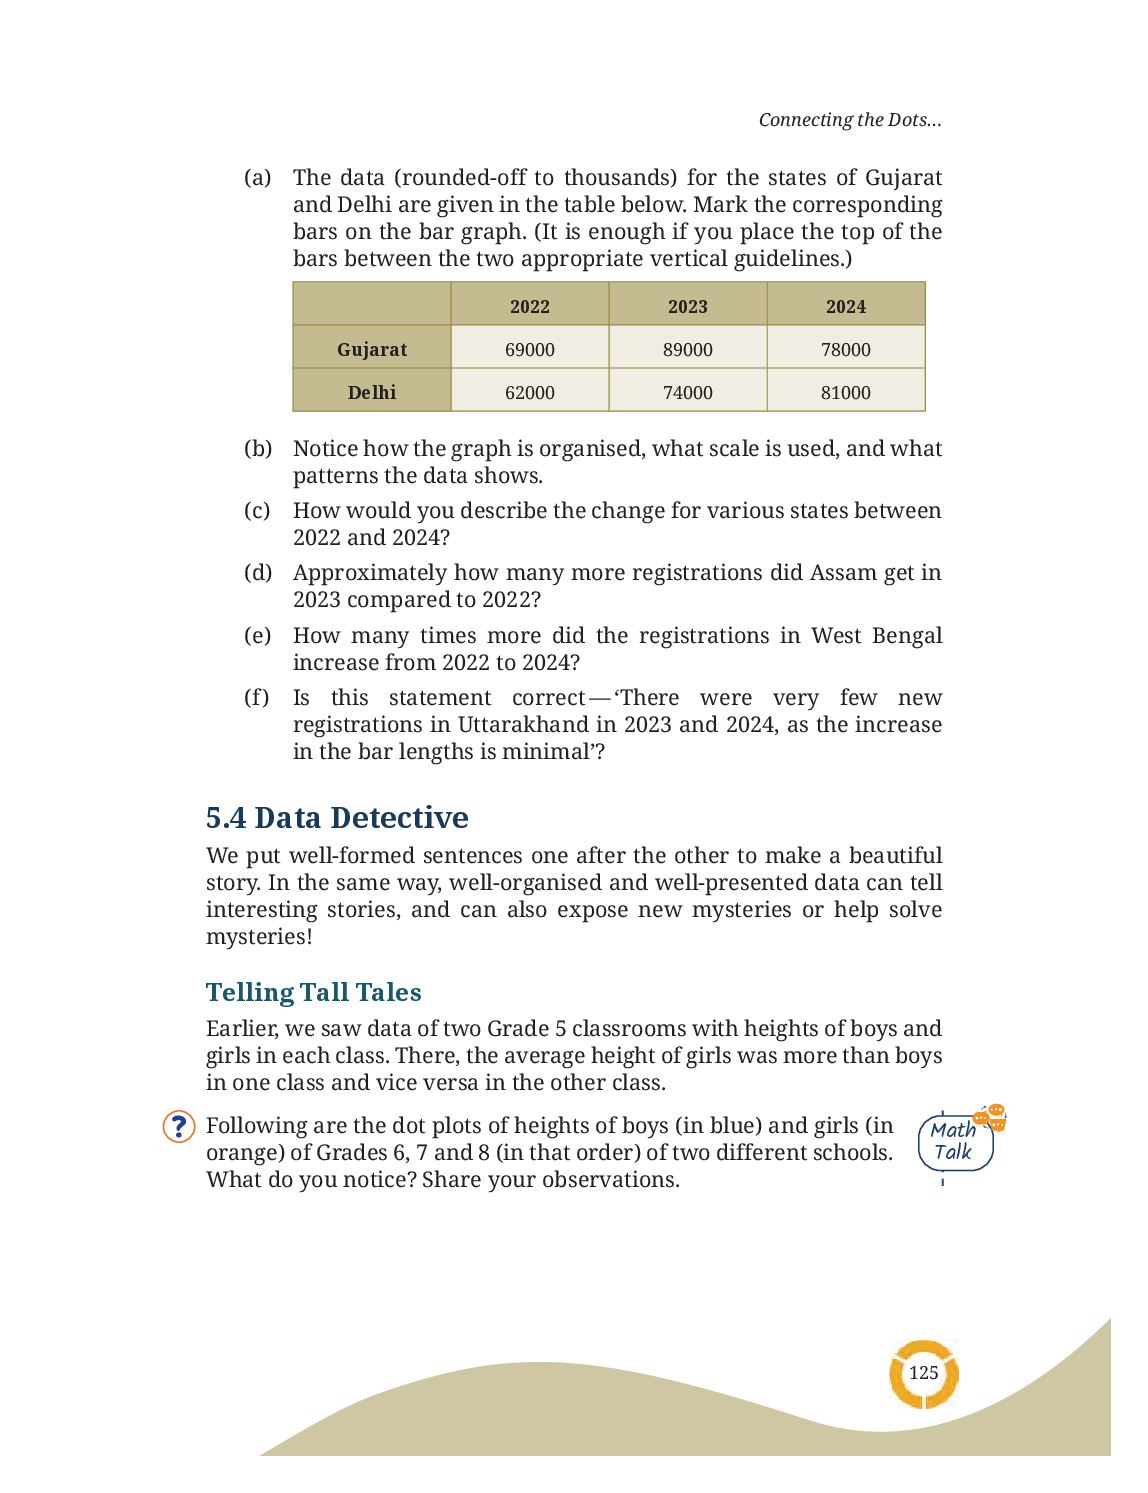
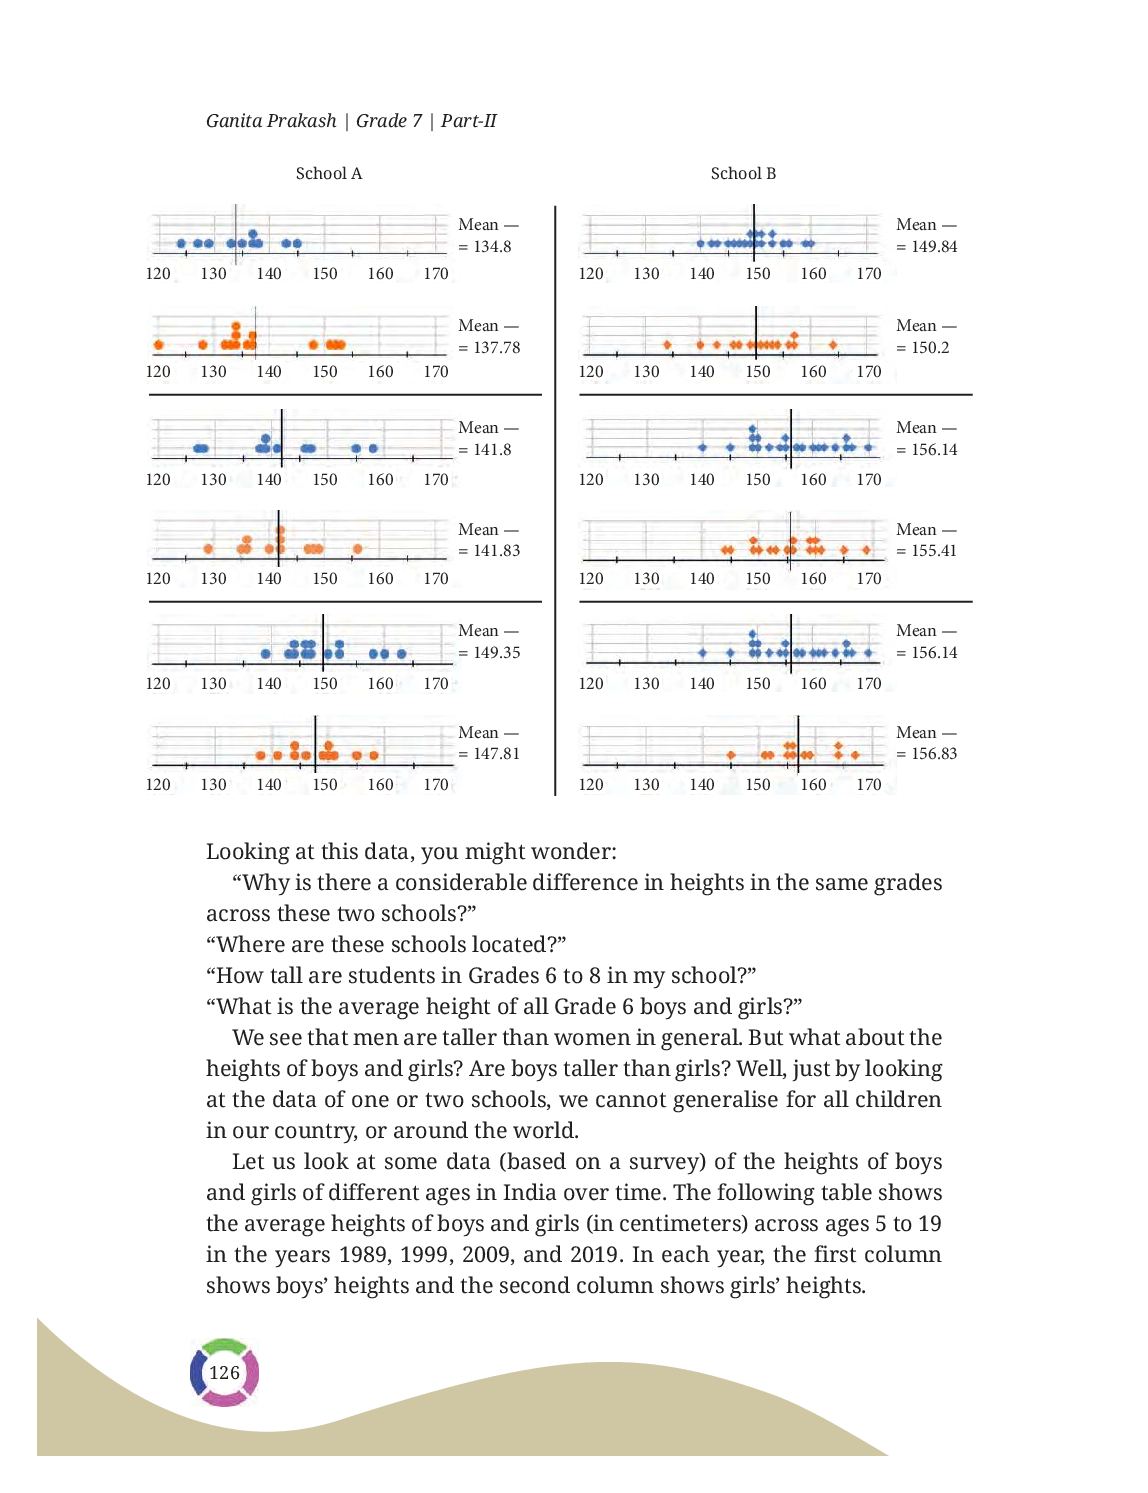
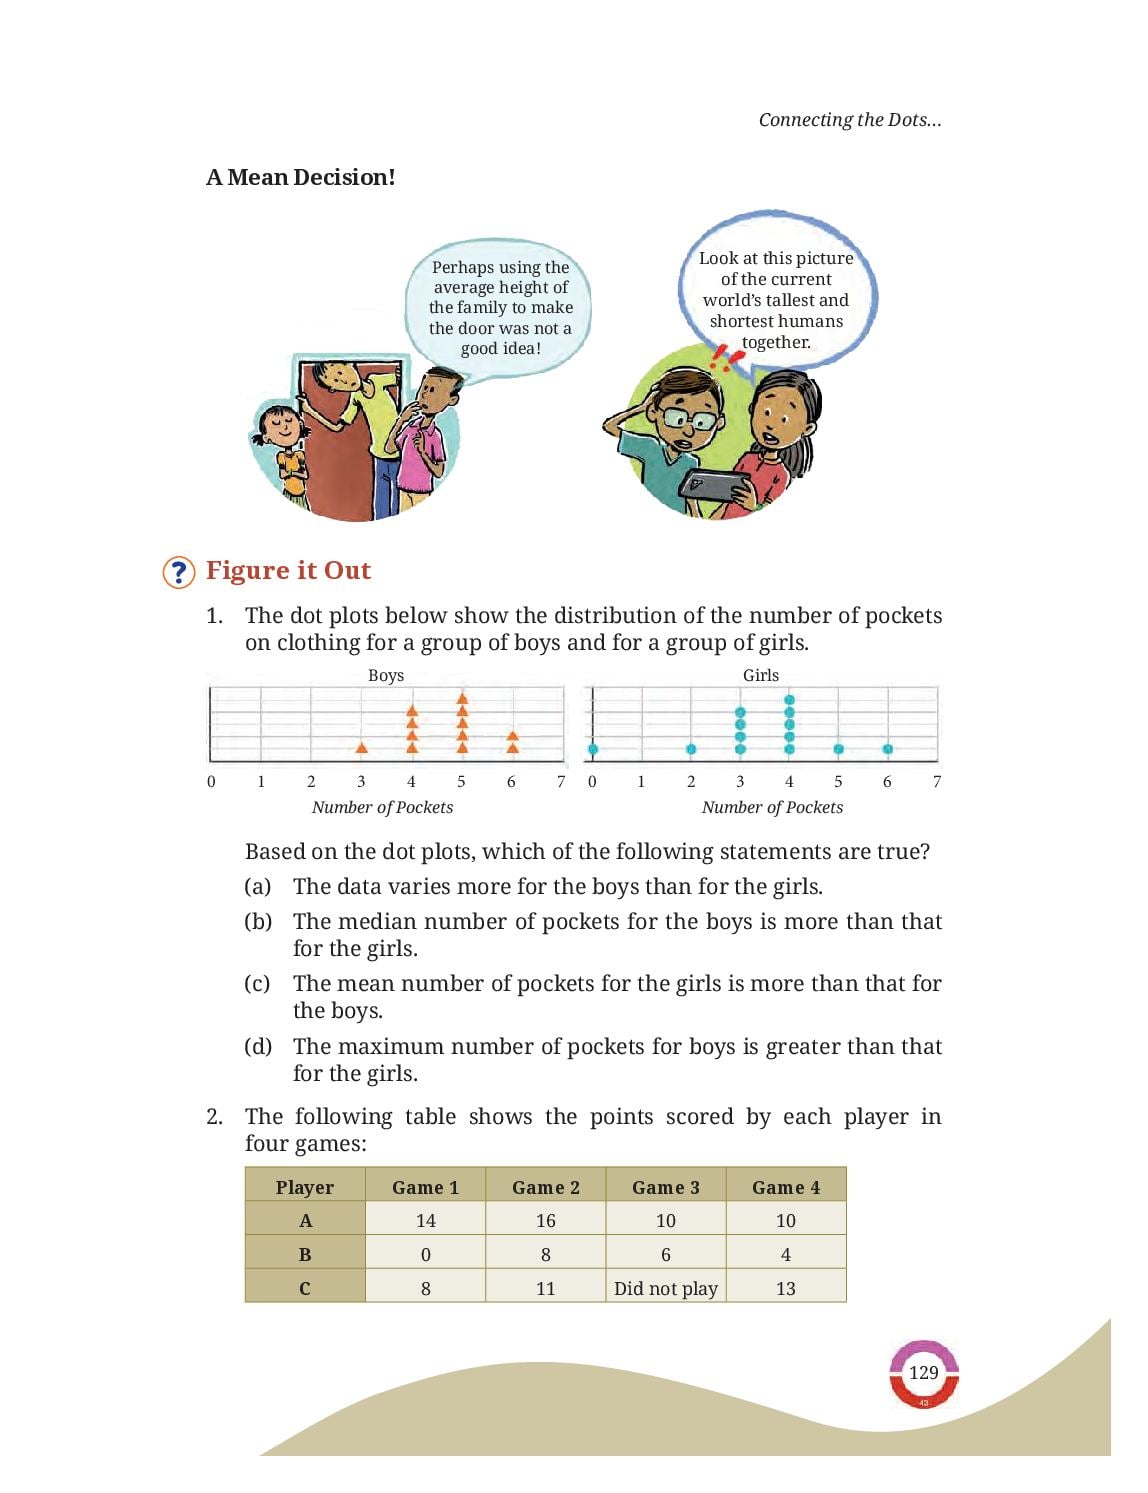
- A dot plot stacks one dot per value on a number line. It shows the minimum, the maximum, the range and where the data clusters — but it loses the original order of the values.
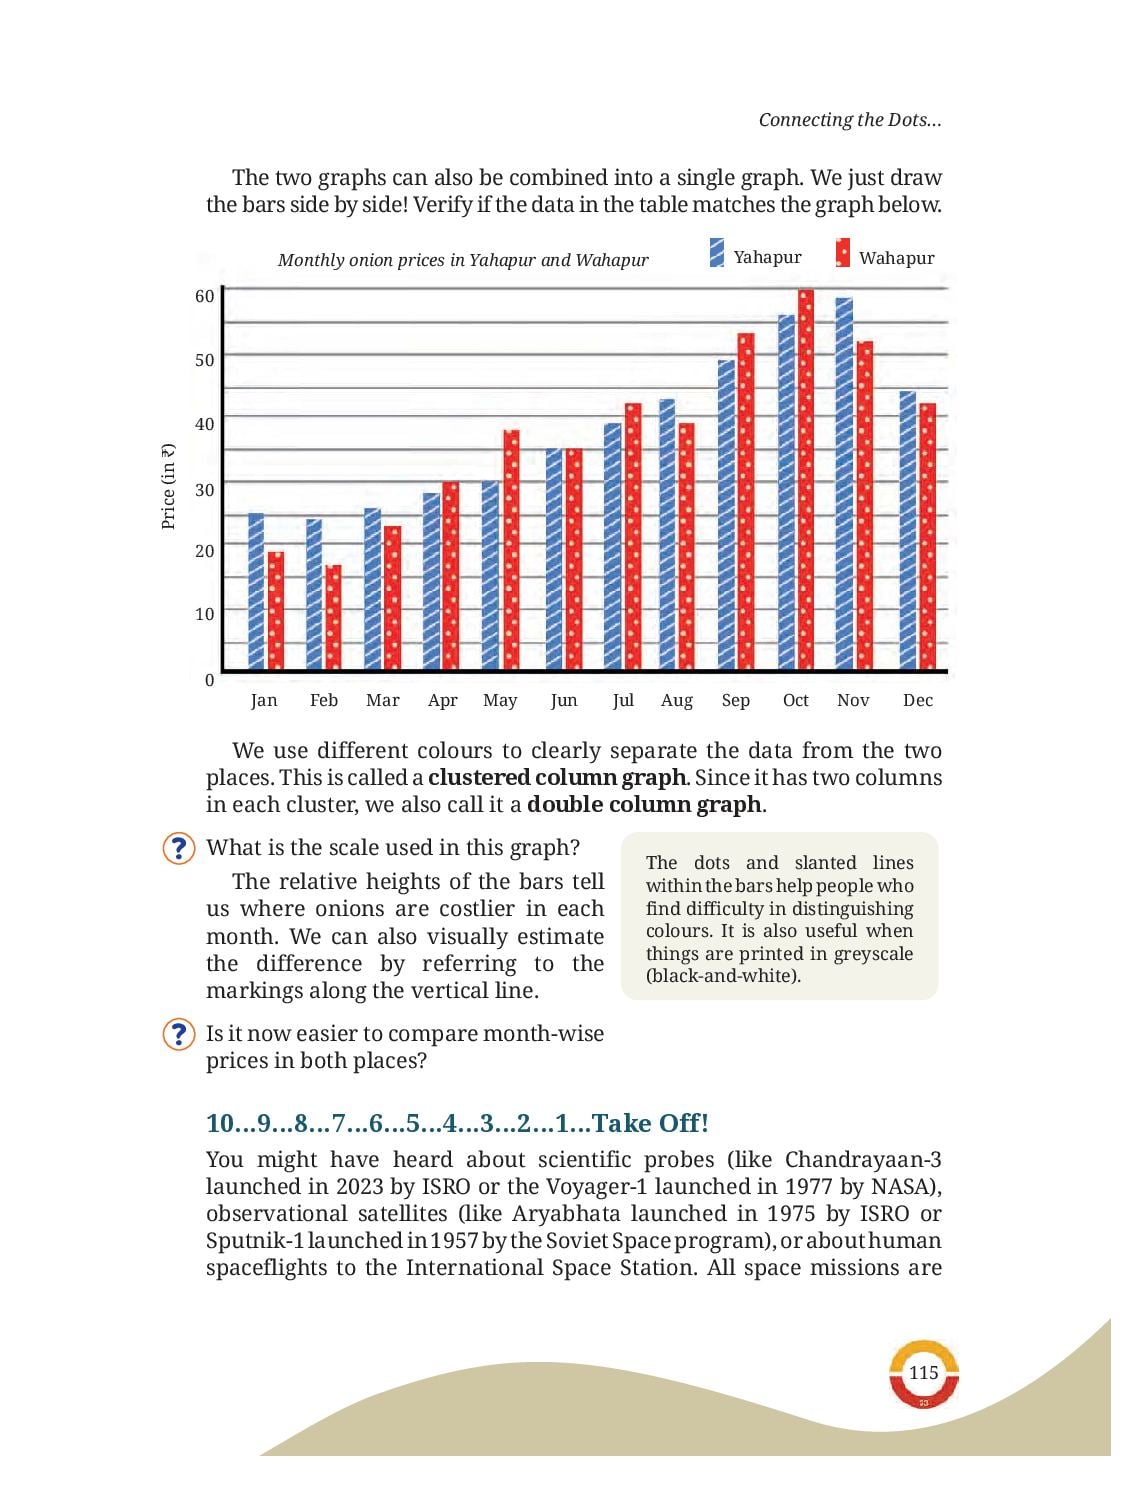
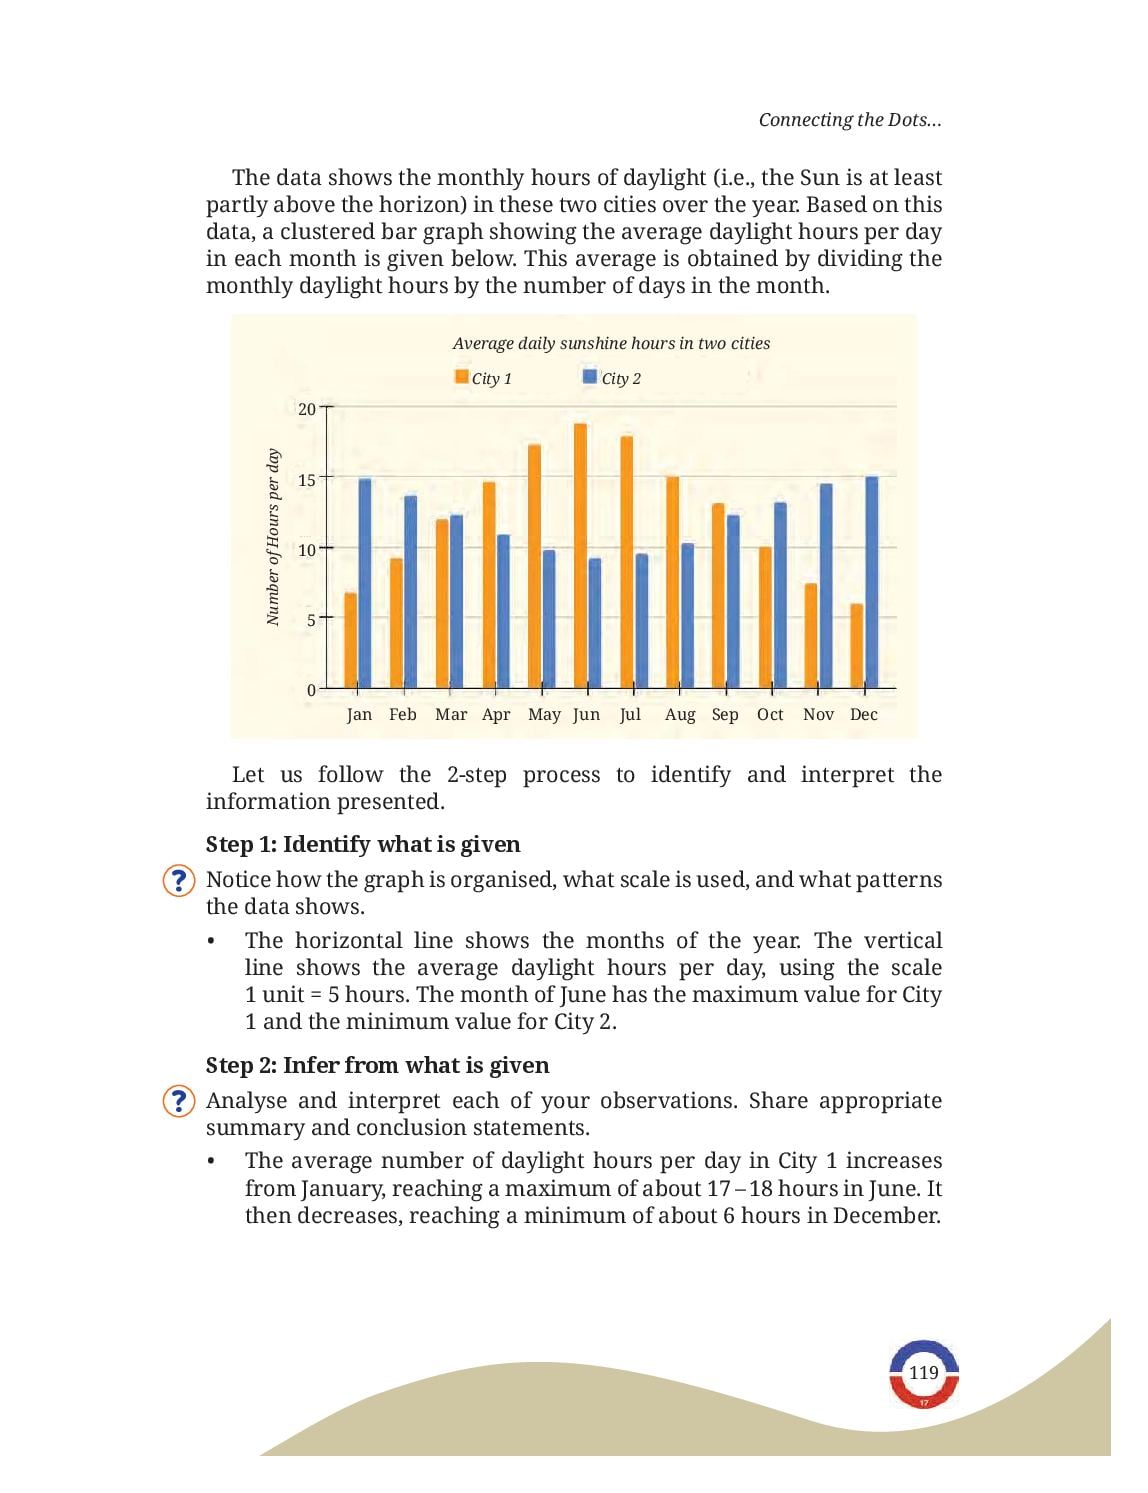
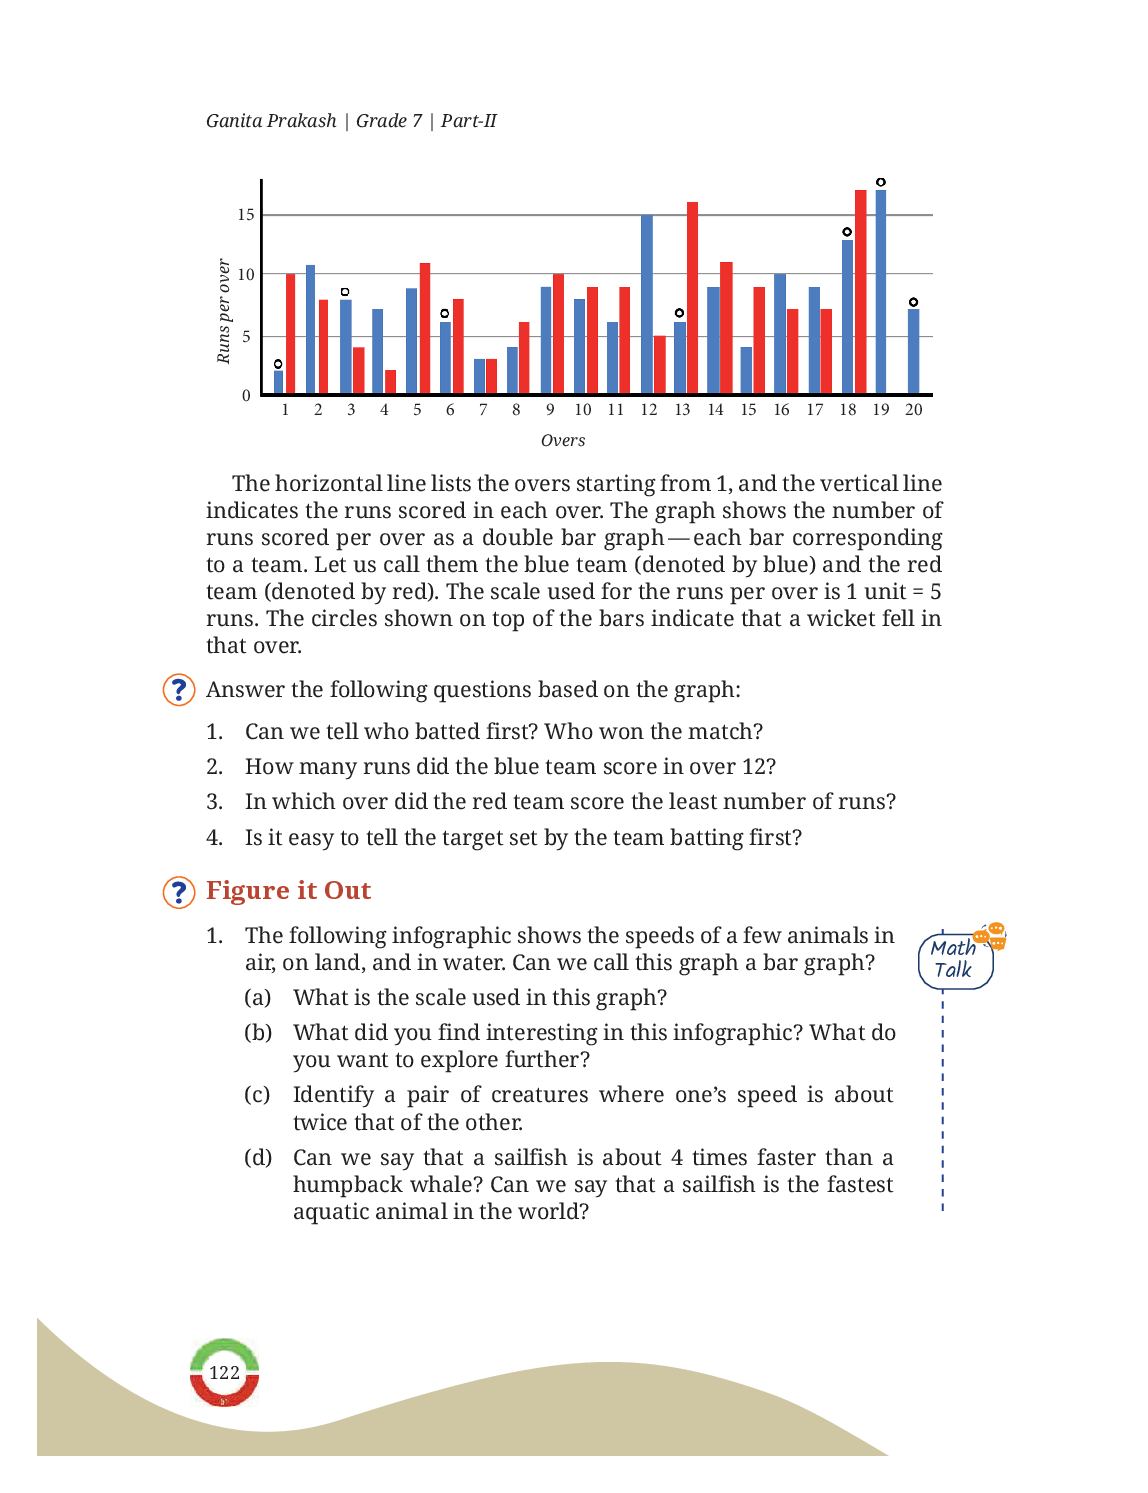
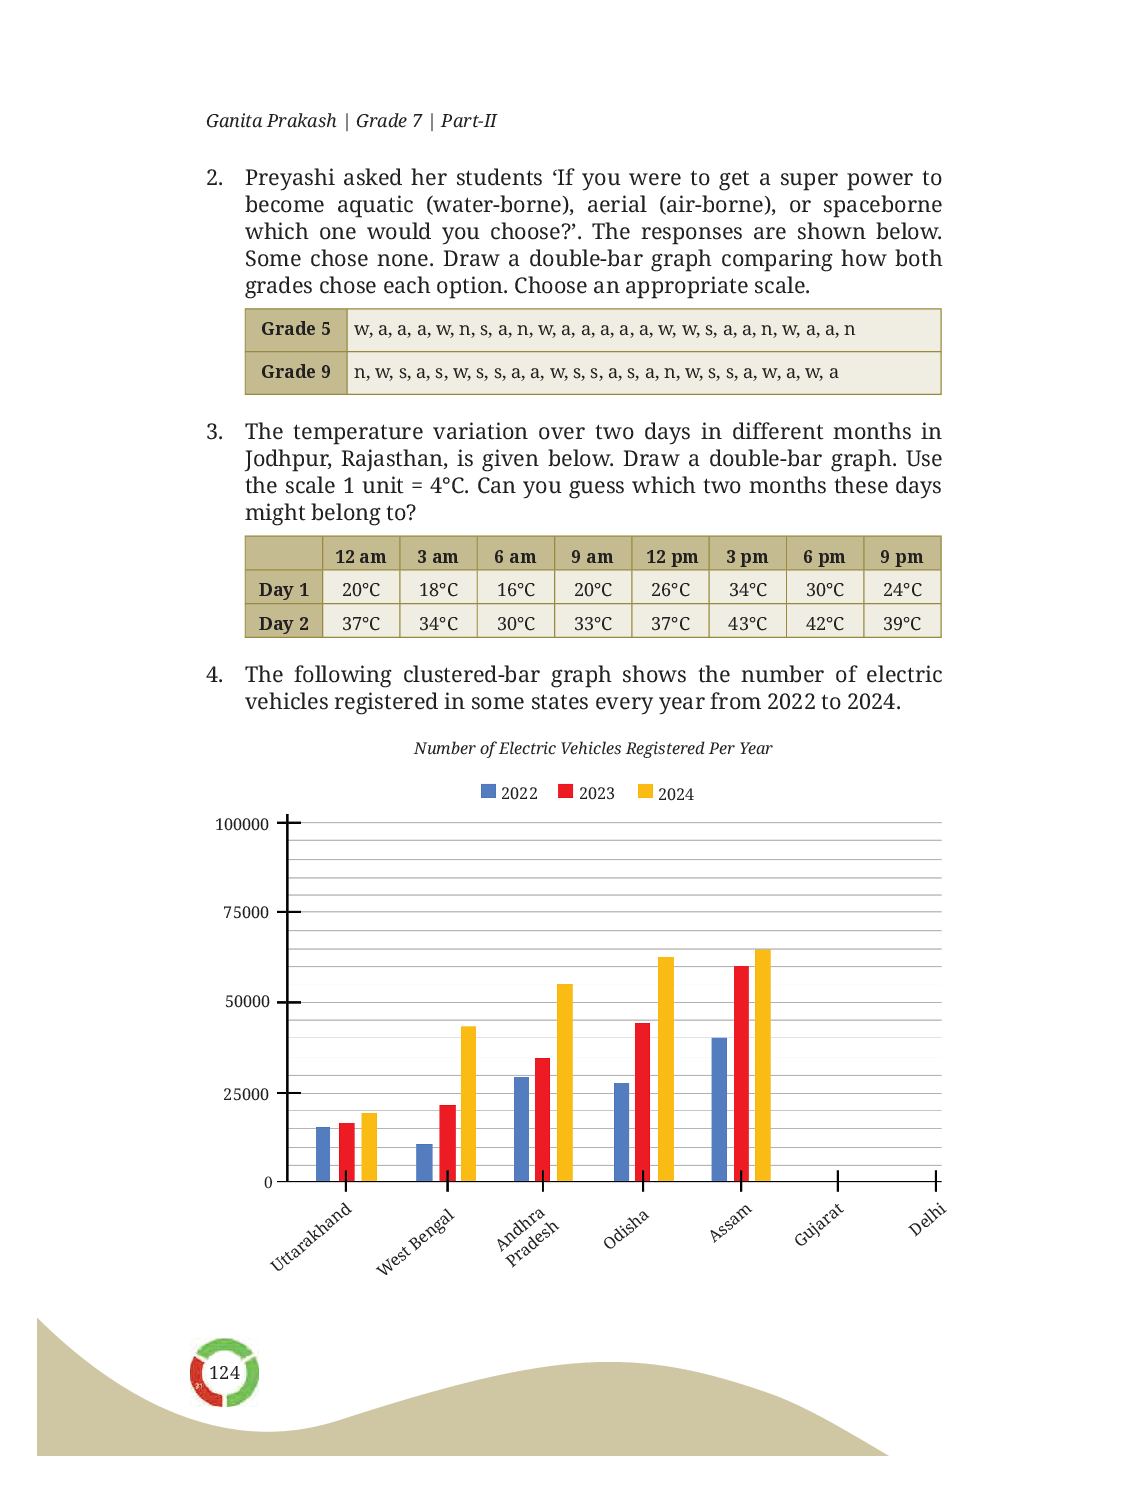
- A clustered (double) bar graph puts two or three bars side by side in each group, so two places, two teams or three years can be compared at a glance.
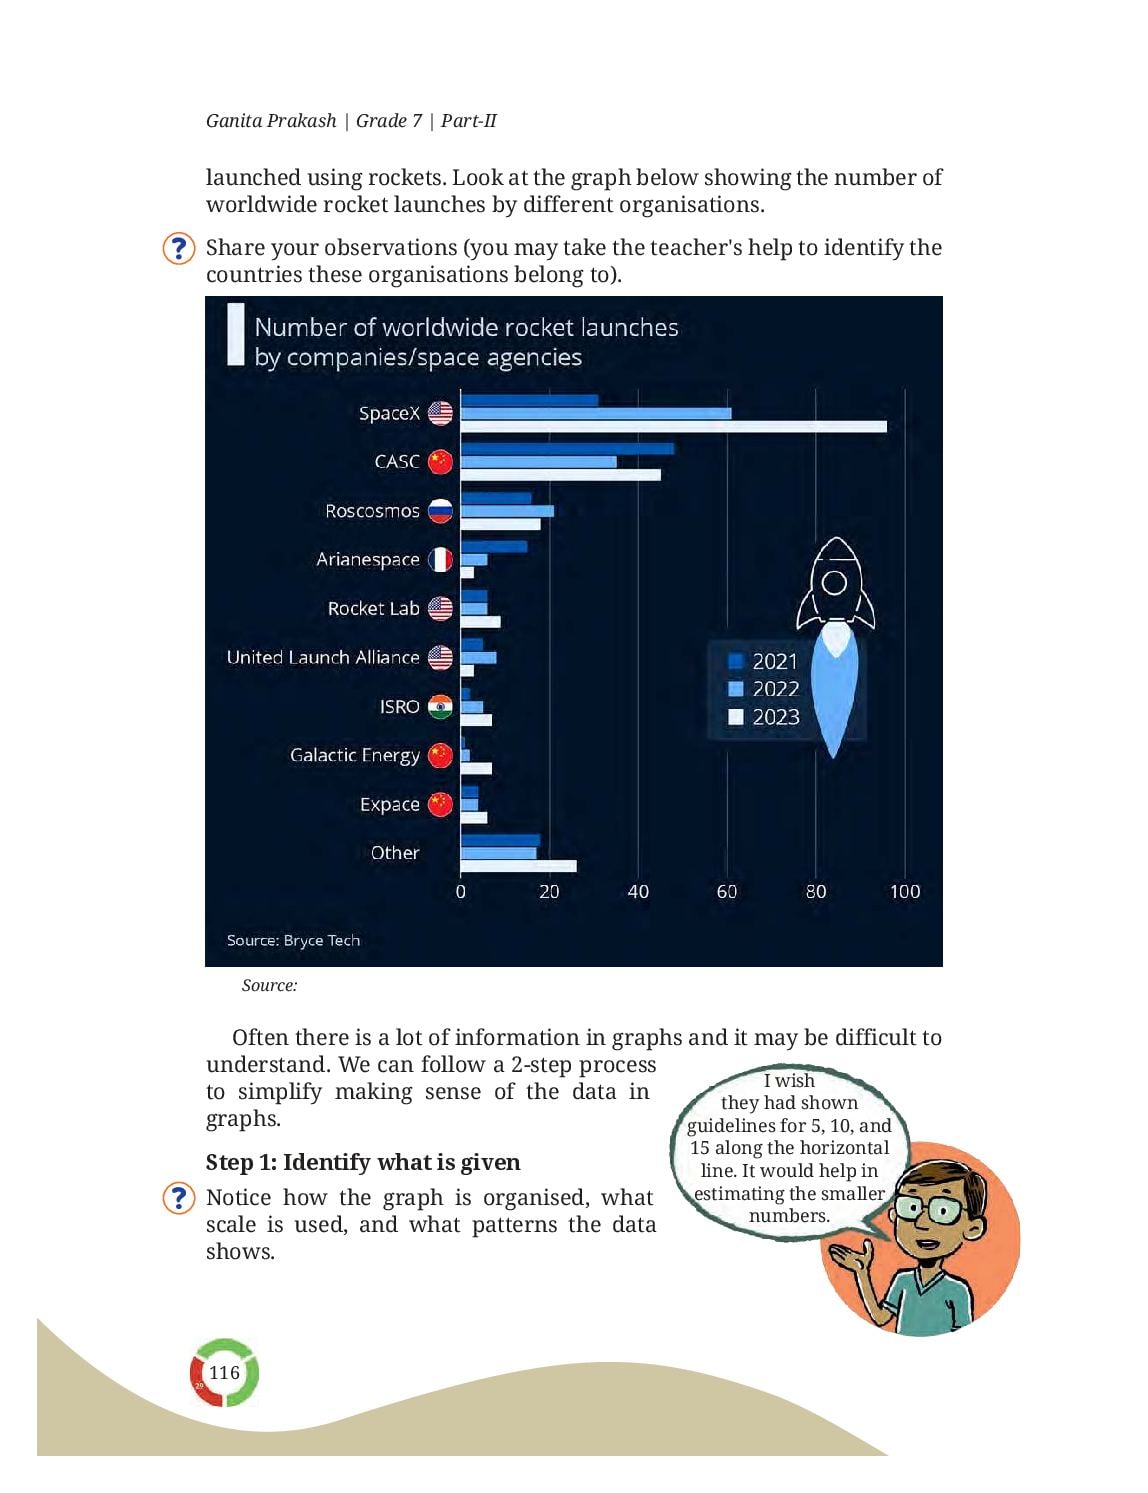
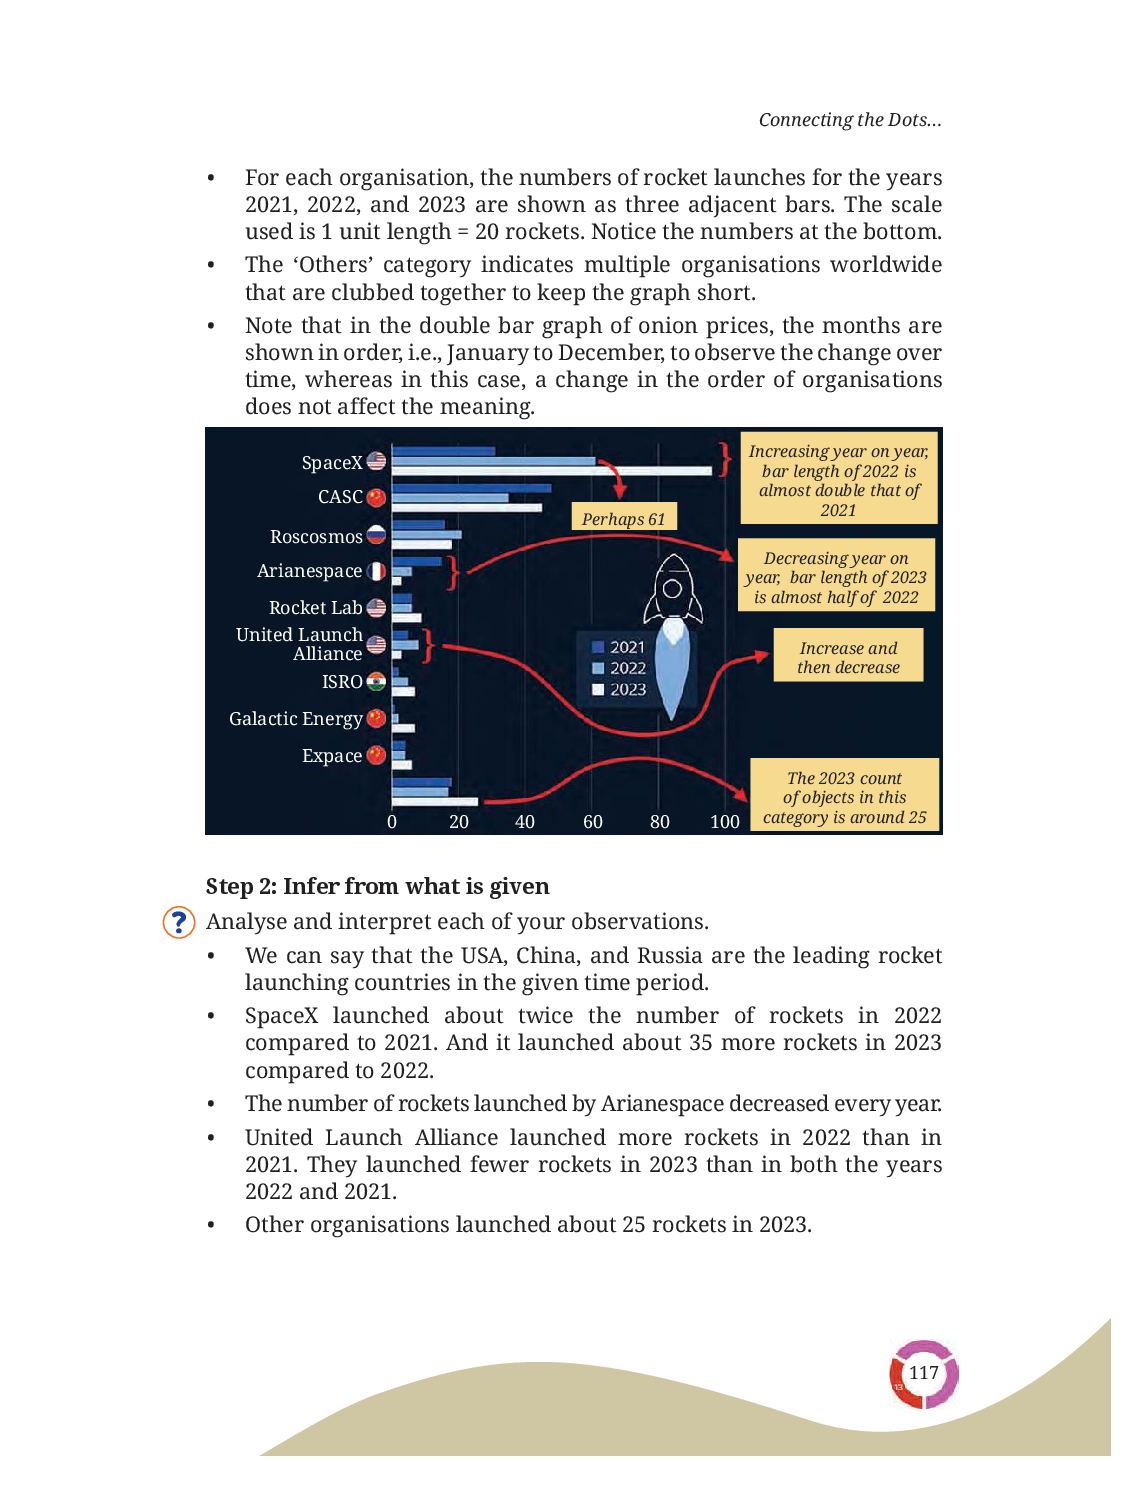
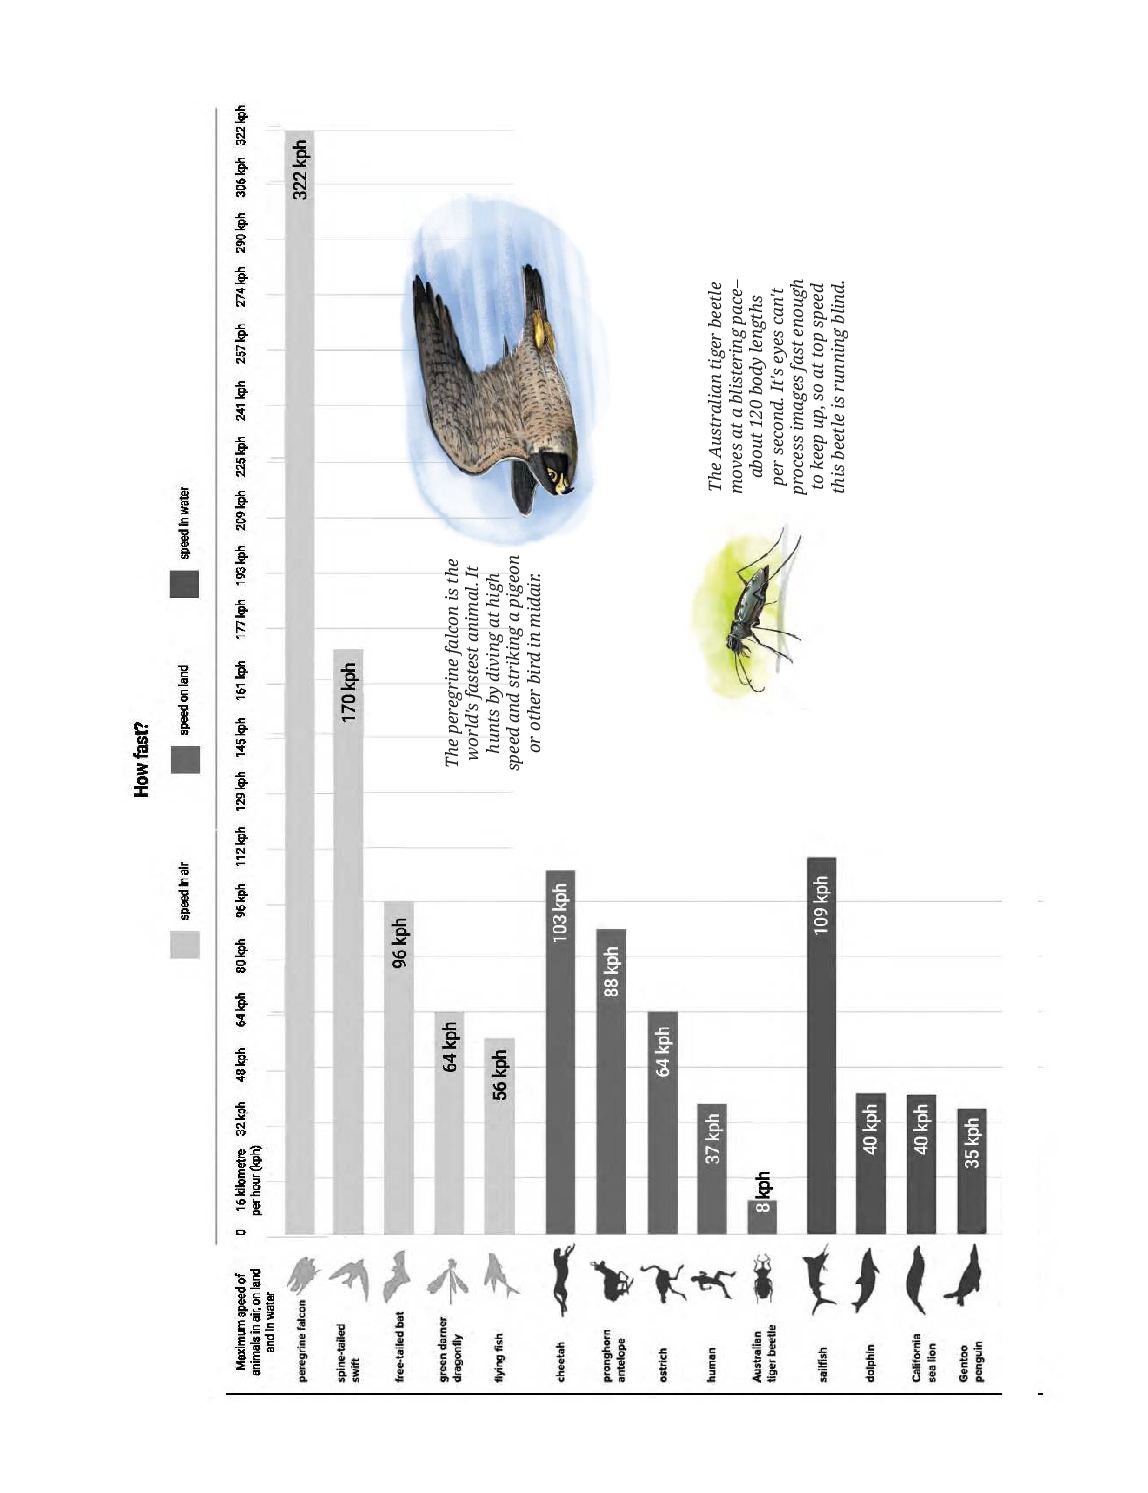
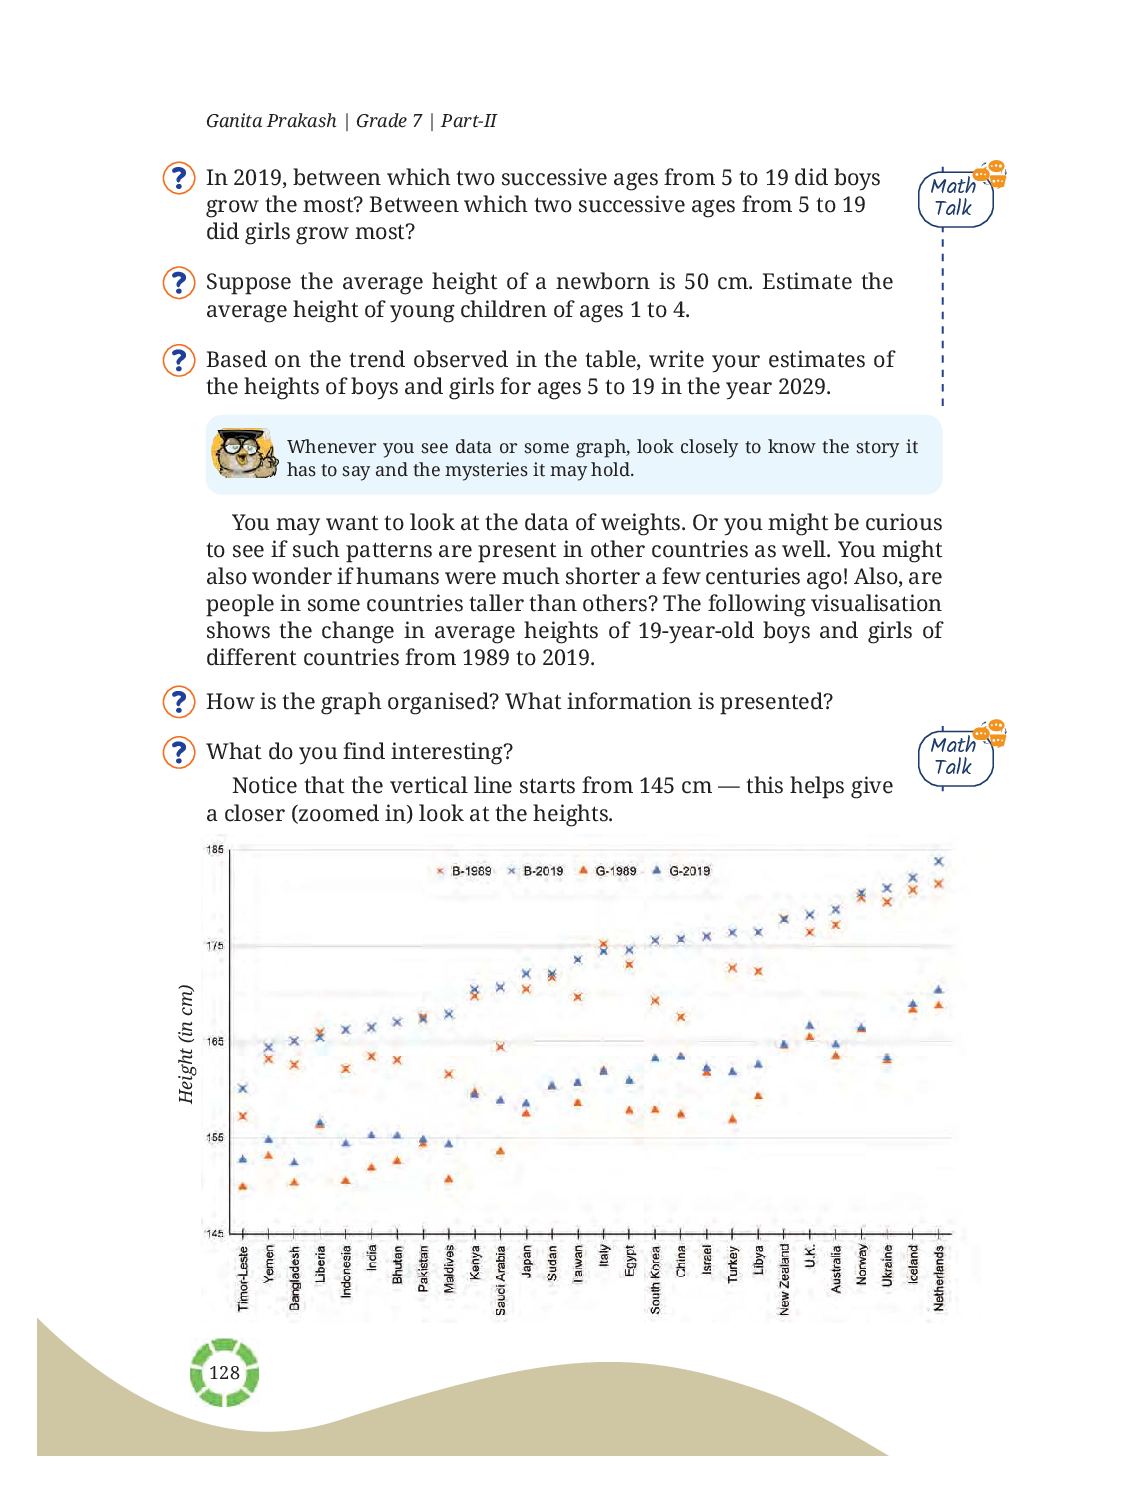
- Read a graph in two steps — Step 1: identify what is given (scale, order, categories); Step 2: infer from what is given. A statement is only justified if the graph itself contains the evidence for it.
Quick revision – Connecting the Dots…
| Idea | What it is | Why it matters | Example |
|---|---|---|---|
| Statistical question | A question answered by collecting data | The answer varies, so one value will not do | How old are the dogs on this street? |
| Not a statistical question | A question with one fixed answer | Nothing varies, so no data is needed | Do you like reading? |
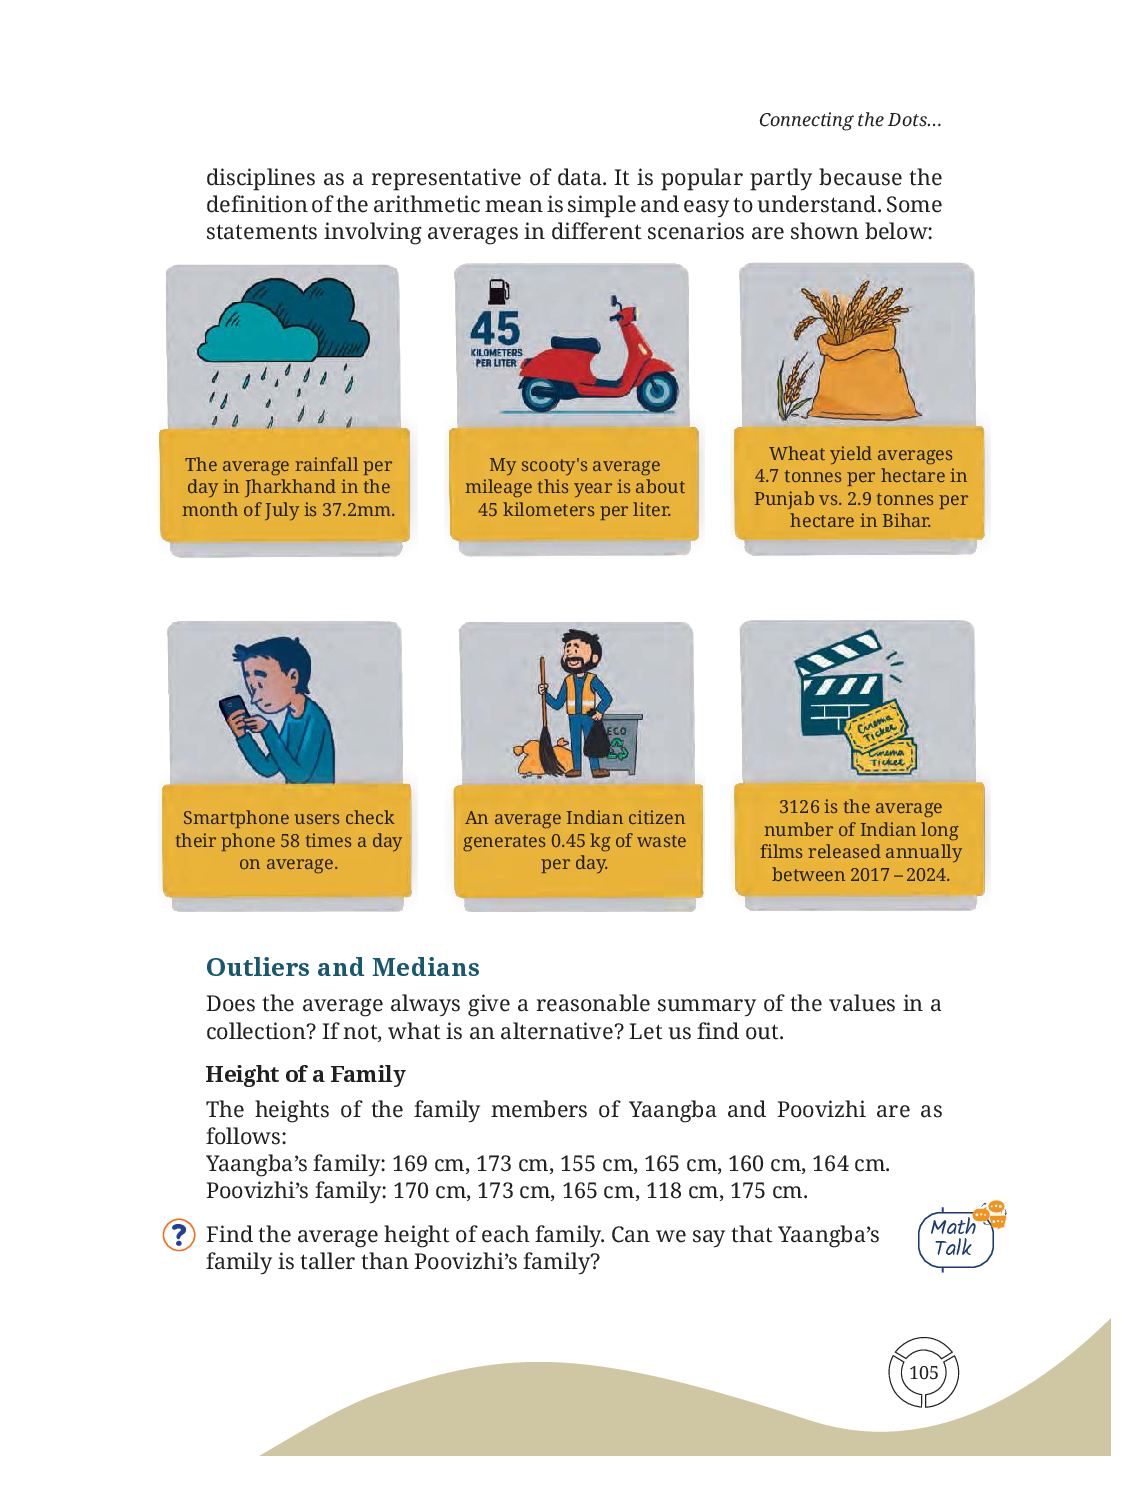
| Mean (Average) | Sum of values ÷ number of values | Balances the highs and the lows into one fair share | (2+7+9+4+3) ÷ 5 = 5 |
| Median | Middle value of the sorted data | Half the values are at or above it | 118, 165, 170, 173, 175 → 170 |
| Median, even count | Average of the two middle values | There is no single middle number | (164 + 165) ÷ 2 = 164.5 |
| Outlier | A value far from the rest of the data | It shifts the mean a lot, the median very little | 118 cm among 165–175 cm |
| Mean < median | Data has a low outlier or a low tail | The mean is pulled down | Poovizhi’s family: 160.2 < 170 |
| Mean > median | Data has a high outlier or a high tail | The mean is pulled up | Short stories: 8.13 > 6 |
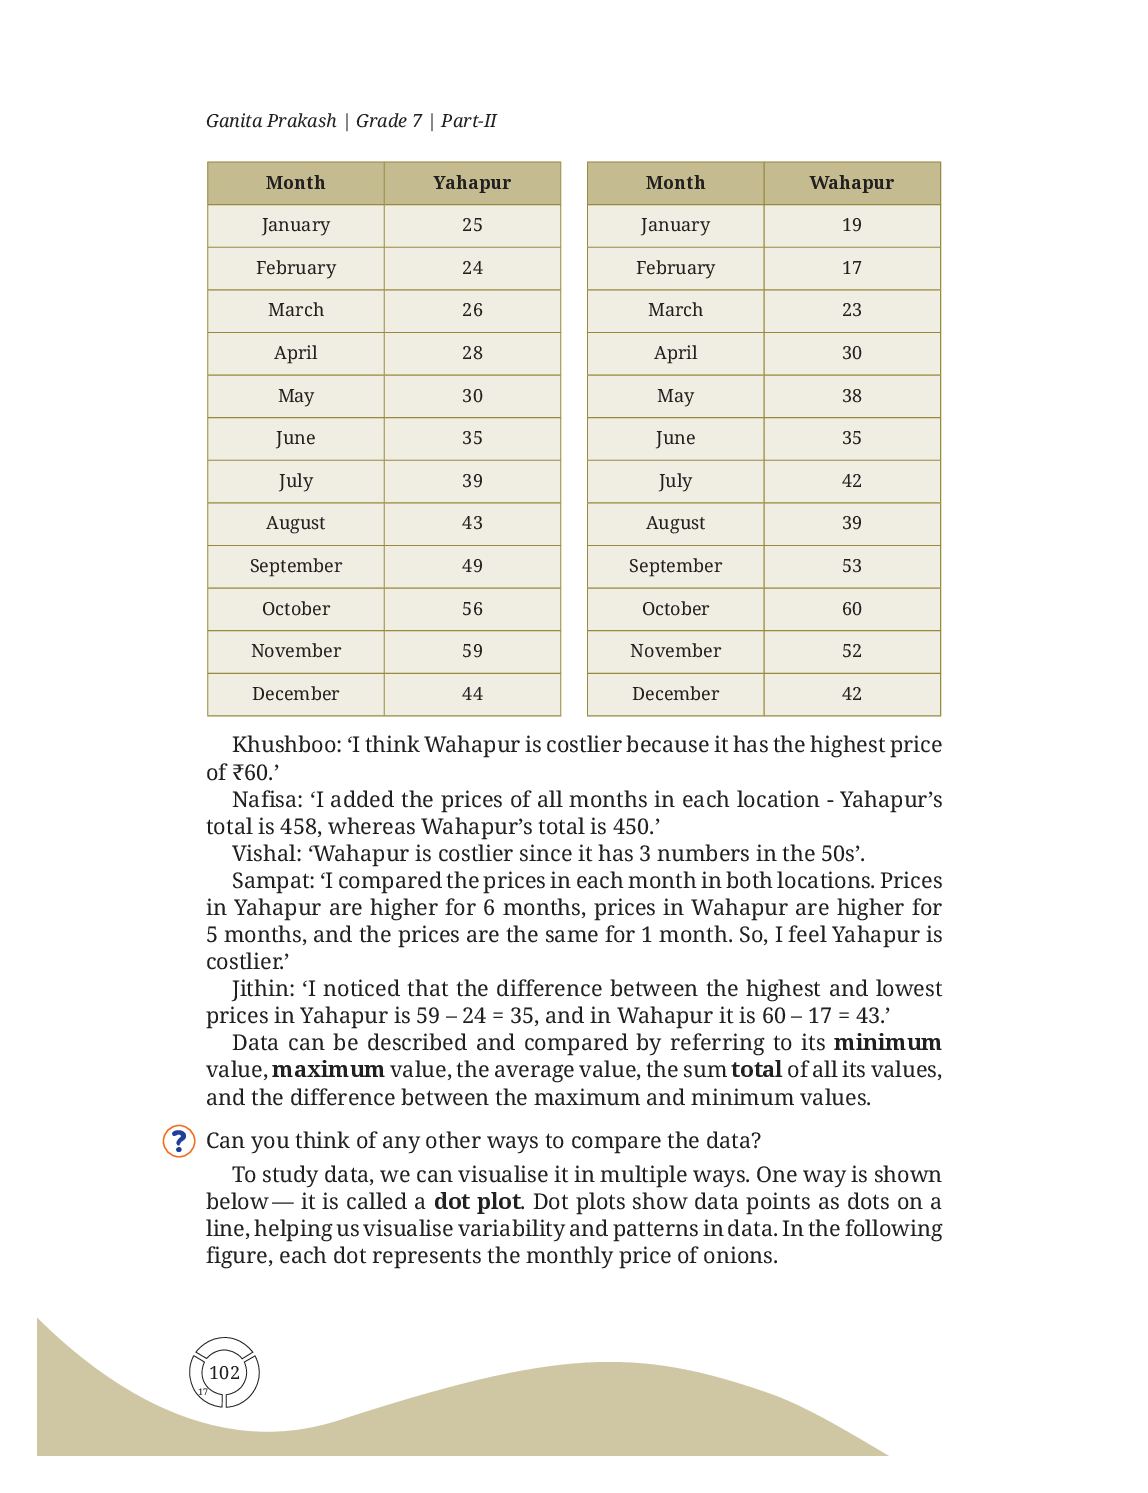
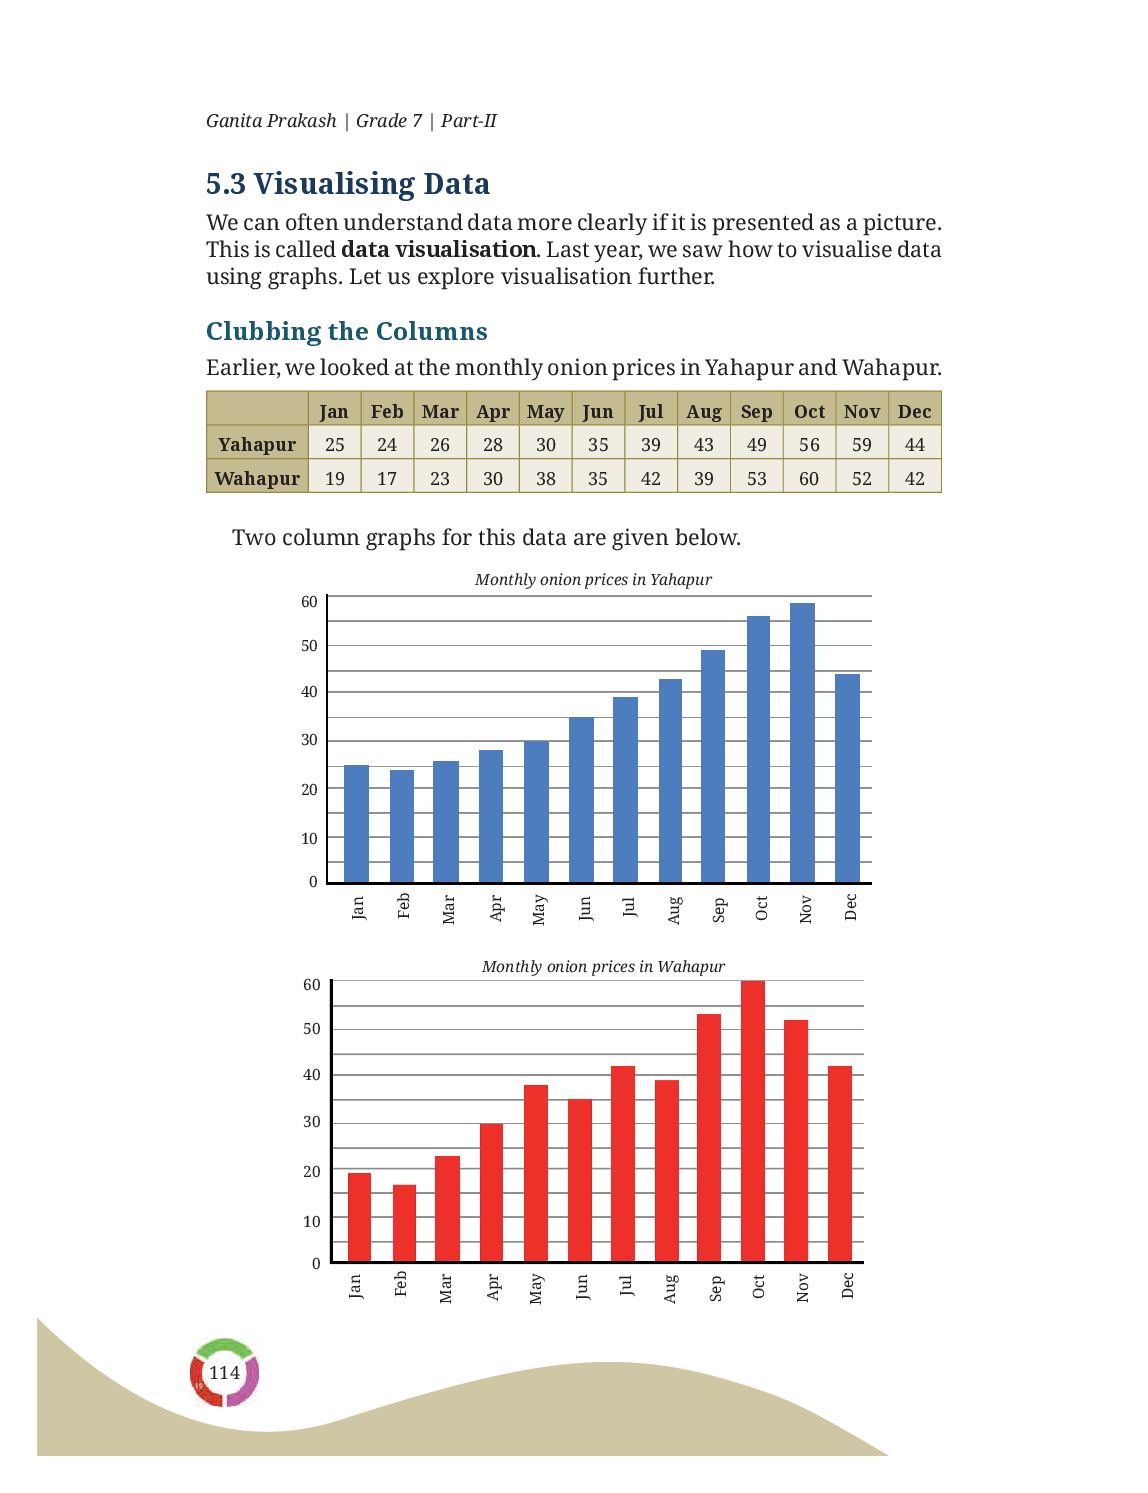
| Range | Maximum − minimum | Measures how spread out the data is | Wahapur onions: 60 − 17 = 43 |
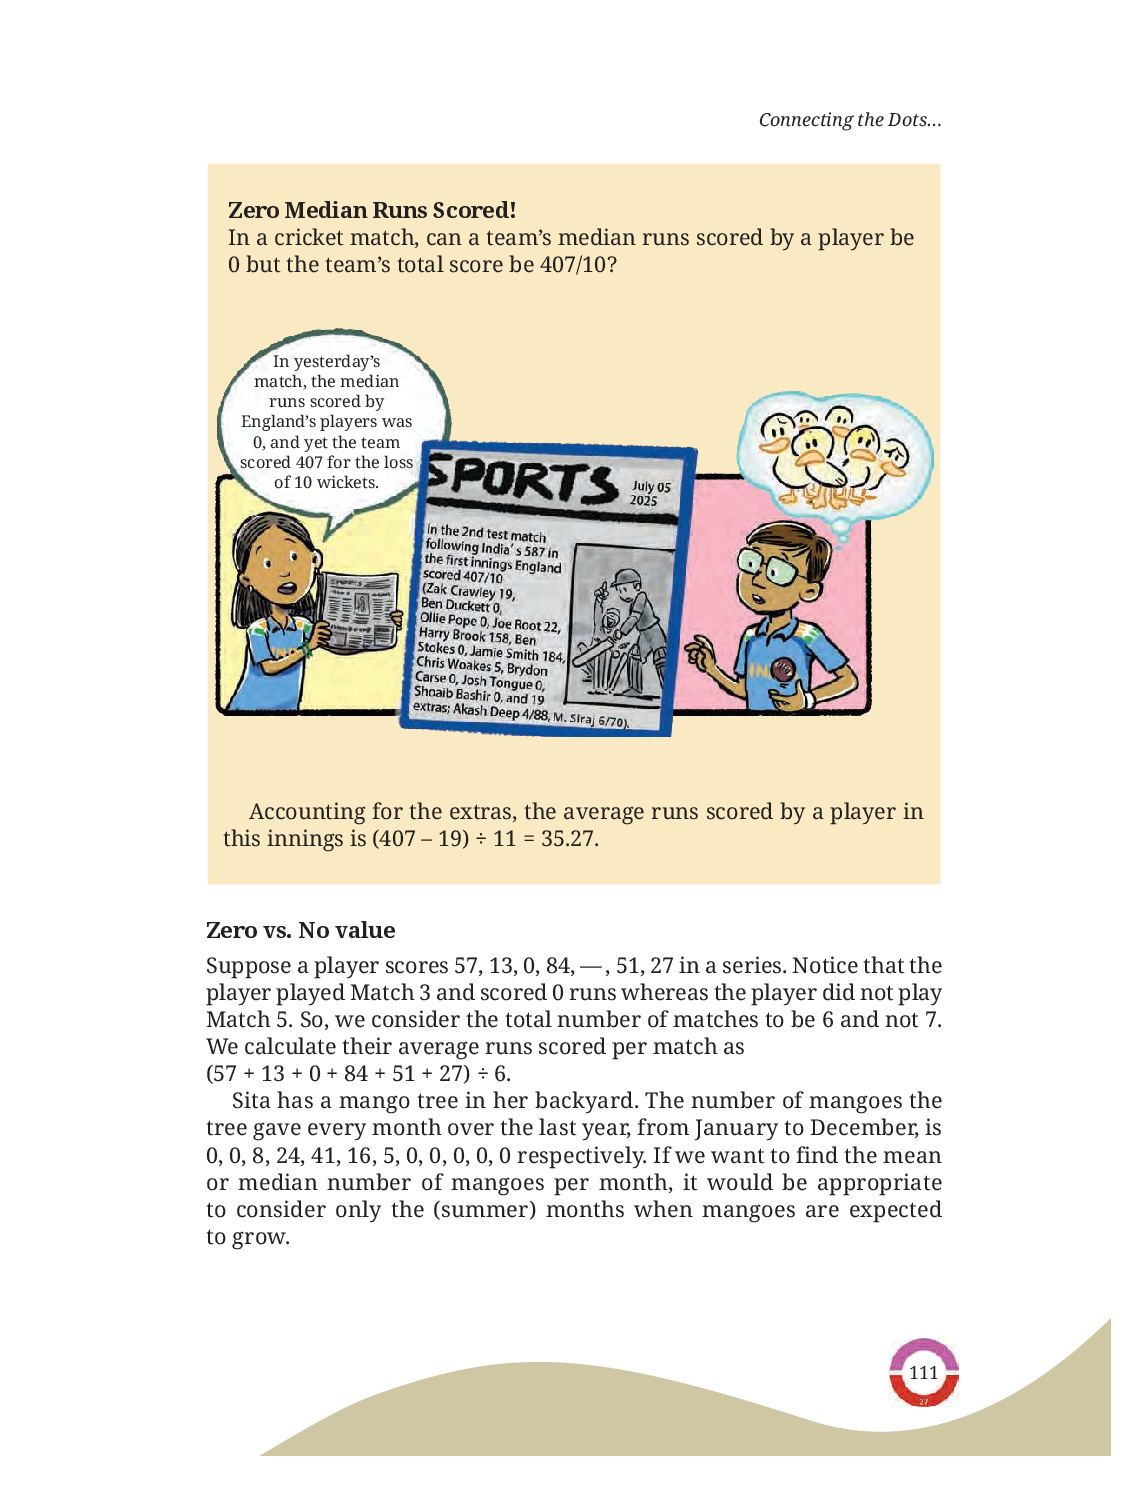
| Zero vs no value | A score of 0 counts; a match not played does not | Dividing by the wrong count gives a wrong mean | (57+13+0+84+51+27) ÷ 6 |
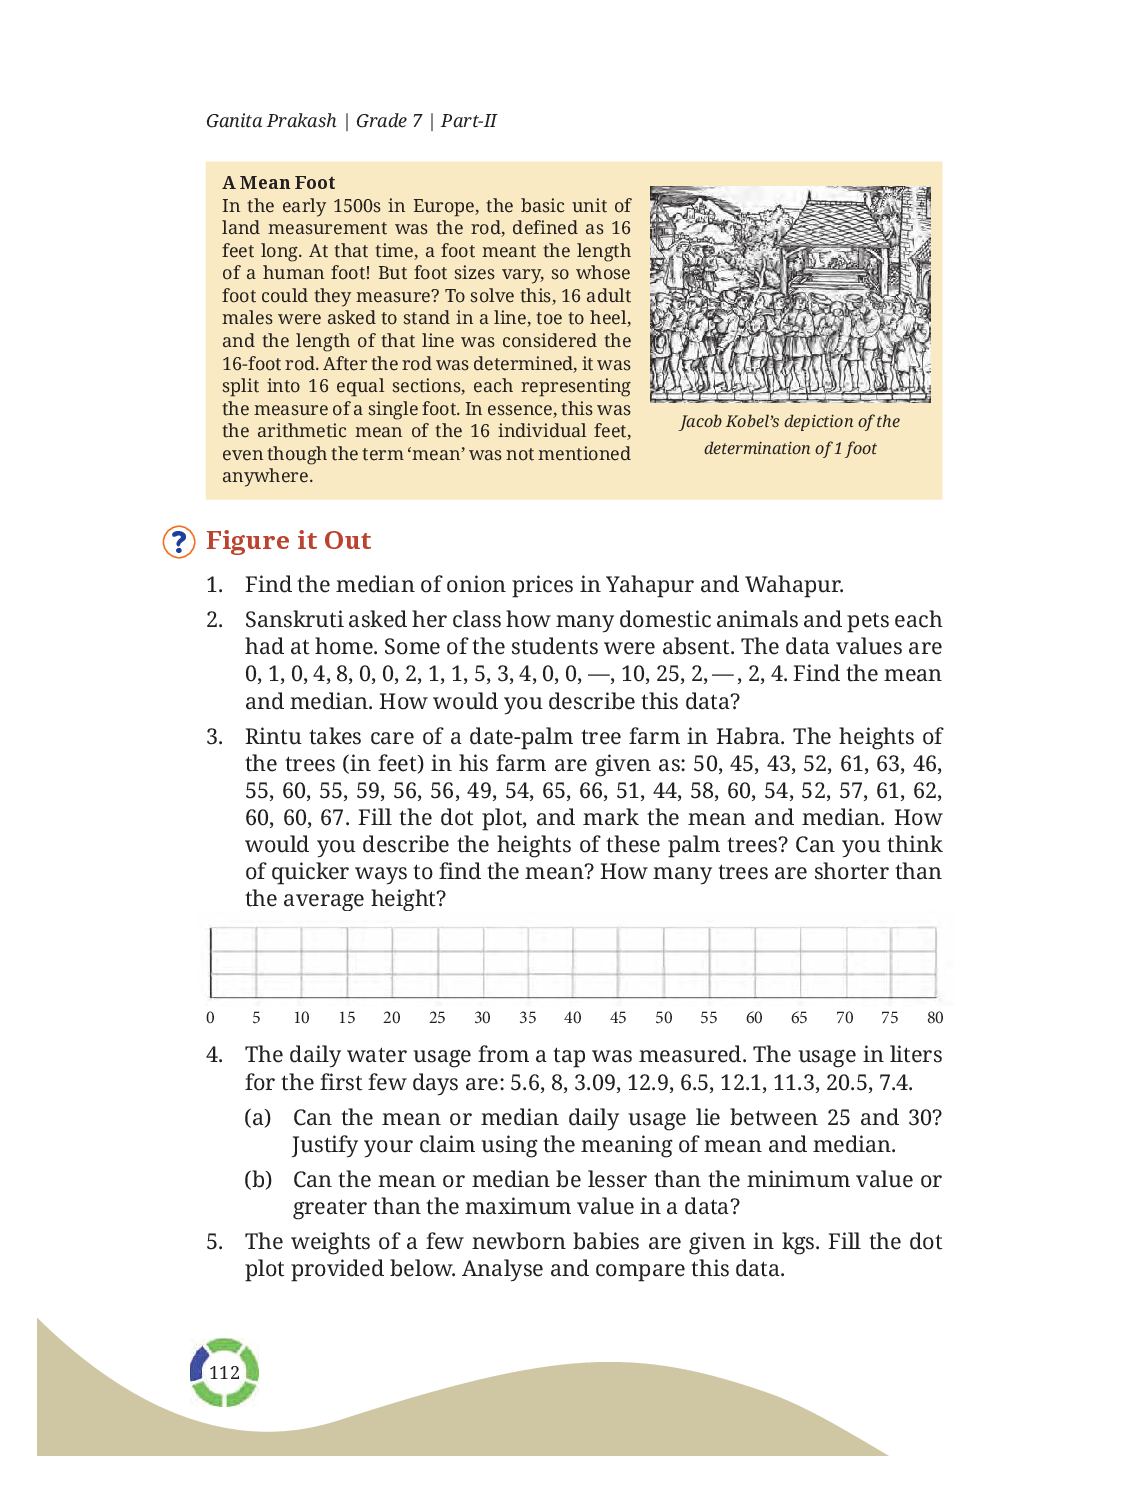
| Dot plot | One dot per value stacked on a number line | Shows clusters, gaps, ends and repeats | Onion prices 10 – 60 |
| Clustered bar graph | Two or three bars side by side per category | Compares groups across categories or years | Yahapur vs Wahapur, month by month |
| Reading a graph | Step 1 identify, Step 2 infer | Stops us claiming more than the data shows | Scale: 1 unit = 20 rockets |
Old NCERT vs New – Class 7 Maths
This chapter is from Ganita Prakash, the new NCERT Class 7 Maths book (NCF-SE 2023, used from 2025-26). It replaced the old book “Mathematics”, so chapter numbers and names differ from older PDFs.
Solutions and All Chapters
Answers to the exercises and the full chapter list of Ganita Prakash:
Connecting the Dots… – Overview
| Class | Class 7 |
| Subject | Maths |
| Book | Ganita Prakash – new NCERT book |
| Part | Part II |
| Chapter | 13 of 15 – Connecting the Dots… |
| Book pages | Part II, 98 – 134 |
| Edition | NCERT Reprint 2026-27 |
| Session | 2026-27 |
| Free – read online or download |
Class 7 Maths Chapter 13 – FAQs
Where can I download Connecting the Dots… Class 7 PDF?
From the download table on this page – the chapter PDF is free, and the full book is linked too.
What is Class 7 Maths Chapter 13 about?
A statistical question is one you answer by collecting data, because the answer varies. A statistical statement is a claim about that data, given as a number, a proportion or a prediction.
Is Connecting the Dots… from the new NCERT Class 7 Maths book?
Yes. It is chapter 13 of ganita prakash (part ii), the new NCERT Class 7 Maths book for 2026-27.
Is this the latest NCERT edition for 2026-27?
Yes – the PDF is NCERT’s latest edition for the 2026-27 session.
Where are the NCERT Solutions for Class 7 Maths Chapter 13?
Open the NCERT Solutions link above for answers to the exercise questions.