• AglaSem
  • Schools
  • Admission
  • Career
  • News
  • Hindi
  • Mock Test
  • Docs
  • ATSE
aglasem
  • CBSE
    • Date Sheet
    • Syllabus
    • Sample Papers
    • Question Papers
  • ICSE / ISC
  • State Boards
    • Date Sheet
    • Admit Card
    • Result
    • Sample Paper
    • Question Paper
  • NCERT
    • NCERT Books
    • NCERT Solutions
    • NCERT Exempler
    • Teaching Material
  • Mock Tests
  • Study Material
    • Notes
    • Solved Sample Papers
    • Maps
    • Writing Skill Format
  • Olympiads
    • ATSE
    • KVPY
    • NTSE
    • NMMS
  • School Admission
  • Entrance Exams
    • JEE Main
    • NEET
    • CLAT
  • Students Guide
    • Careers Opportunities
    • Courses & Career
    • Courses after 12th
  • Others
    • RD Sharma Solutions
    • HC Verma Solutions
    • Teaching Material
    • Classes Wise Resources
    • Videos
No Result
View All Result
aglasem
No Result
View All Result

Class 10 Data Interpretation Samples, Charts

by Anuj William
March 15, 2022
in 10th Class
Reading Time: 4 mins read
0
  • ATSE 2022, Olympiad Registration Open.
  • HCL Techbee: Earn n Learn Prgorame for Class 12

This form of writing is used to interpret the facts presented in the form of table, graph or chart. A graph or chart is a visual stimulus to depict the data. Data interpretation requires an analysis and comparison of the given facts and drawing conclusions based on the given data.

SOLVED EXAMPLES:

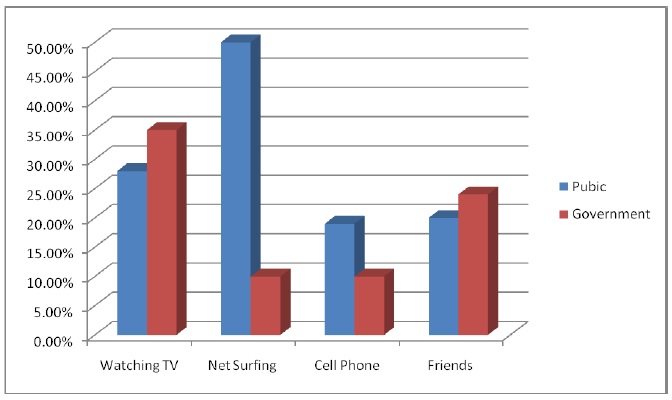
1-Study the chart given below, which is the result of the survey conducted in the public schools and government schools of Vadodara. This depicts the types of activities the teenagers (Age 13- 19 years are involved during their leisure time). Complete the summary in about 80 words.

Teenagers and leisure time

Now a days the teenagers are more techno-savvy than the children used to be ten years back. They do not play games like Ludo, Carrom, Chess and other indoor games. 9-18 % of boys and girls in the age group of 13-19 years possess their own cell phones. In the survey conducted recently on some 2000 students of two leading schools- one government and the other a public school, the following facts were revealed. While the students from public schools spend more of their leisure time in net-surfing and talking on cell phones, the government school students spend it in watching TV and talking to their friends.

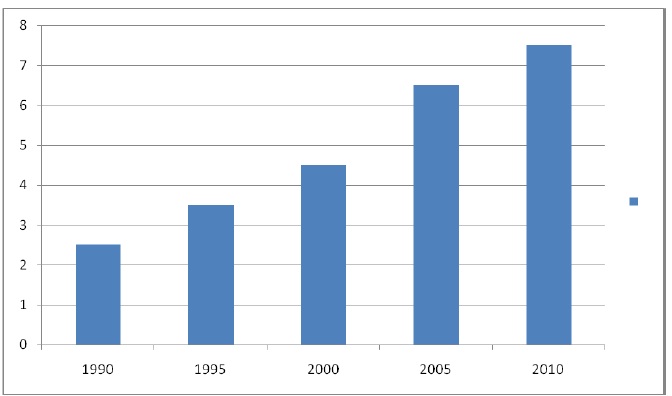
2- The following data in the form of histogram shows that death due to violence has increased considerably during recent years. Write its interpretation in 100 words on how educated youth can play a major role in establishing peace in society.
/

Role of youth in establishing peace in society

Youth and peace are interlinked in society. Youth can play an important role in establishing peace in society. In a survey conducted, it has been found that number of deaths due to violence has increased enormously since the nineties. Death rate in 1000s was 2.5 in 1990. But in 2010, it has increased to 7.5. It is really very sad. It must be checked.

Our youth can play a major role in controlling this crime graph. They can contribute towards establishing peace in many ways. They can awaken the people towards the necessity of peace. They can help the police in catching the criminals. They can bring the criminals in the main stream by educating them and they can do much more.

UNSOLVED EXAMPLES:

1- Study the graph given below, which is based on a survey done on students of tenth class in three different types of schools in Ahmedabad. The chart depicts the number of students speaking English and Hindi. On the basis of the details given in the bar-graph given below, briefly summarize the data making comparison wherever necessary in about 80 words.

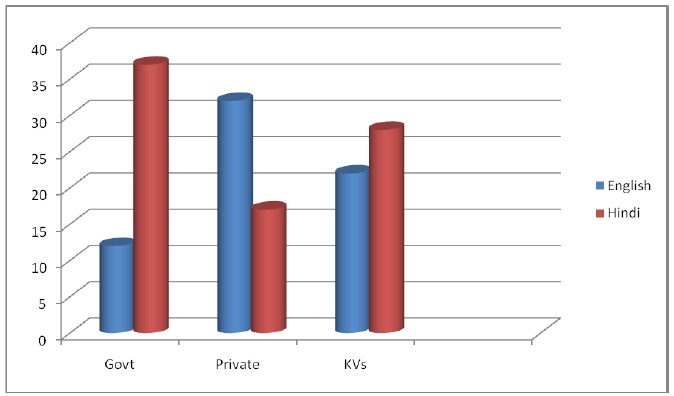
Hint- Compare the percentage of students speaking English and Hindi in all three schools giving the possible reasons.

Begin Like this:-

In a study conducted on the students of class tenth of three various types of schools- Government school, private school and a KV, it was observed that

2. As an aware citizen of the country, you are concerned about the increase in road accidents in the metropolitan city Delhi. Interpret the data given below in about 80 words. Also use your own ideas.

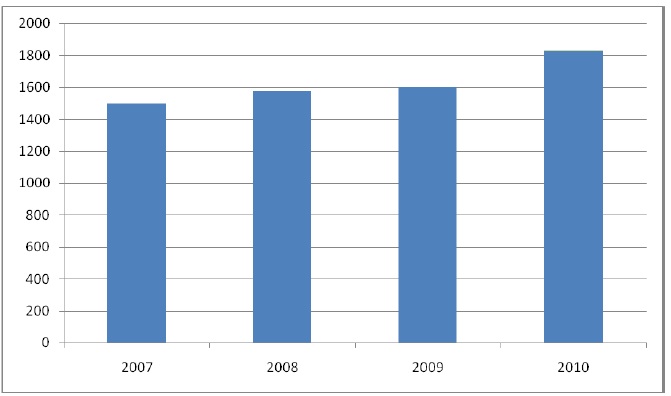
Horizontal line (x-axis) – years
Vertical line (y-axis)-No. of accidents

3-Give below is a pie-Chart, which shows different types of electric gadgets, used by middle-class people in their houses on an average in Ahmedabad. On the basis and the unit ‘Science’ of your Main course Book; write in about 80 words the reason of selecting the electric gadgets for their houses.

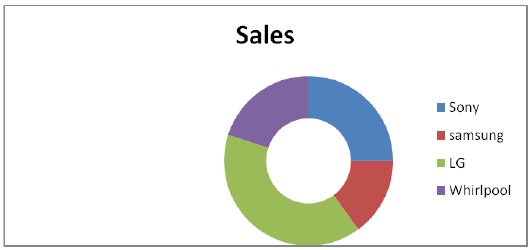
Take into consideration the price range, durability, lower electric consumption & after sales-service.

Writing Skills
CBSE Class 10 English Study Material

To get fastest exam alerts and government job alerts in India, join our Telegram channel.

Tags: CBSECBSE Class X Support MaterialCBSE Support MaterialClass 10thKV Study MaterialWriting Format

Anuj William

Related Posts

Tamil Nadu Board Result
10th Class

TN 10th Result 2022 (Out) – Check Tamil Nadu SSLC Result Link at tnresults.nic.in

10th Class

NCERT Exemplar Class 10

10th Class

NCERT Exemplar Class 10 Maths

10th Class

NCERT Exemplar Class 10 Maths Unit 2 Polynomials

Next Post

Class 10 Diary Entry Format

Leave a Reply Cancel reply

CBSE Board Quick Links

  • CBSE Date Sheet
  • CBSE Result
  • CBSE Syllabus
  • CBSE Sample Papers
  • CBSE Question Papers
  • CBSE Notes
  • CBSE Practice Papers
  • CBSE Mock Tests

Class Wise Study Material

  • Class 1
  • Class 2
  • Class 3
  • Class 4
  • Class 5
  • Class 6
  • Class 7
  • Class 8
  • Class 9
  • Class 10
  • Class 11
  • Class 12

Registration Open!!

  • ATSE 2022, Olympiad Registration Open.
  • HCL Techbee: Earn n Learn Prgorame for Class 12

For 2022

  • Solved Sample Papers
  • Maps
  • Revision Notes
  • CBSE
  • State Board

Study Material

  • Class Notes
  • NCERT Solutions
  • NCERT Books
  • HC Verma Solutions
  • Courses After Class 12th

Exam Zone

  • JEE Main 2022
  • NEET 2022
  • CLAT 2022
  • Fashion & Design
  • Latest
  • Disclaimer
  • Terms of Use
  • Privacy Policy
  • Contact

© 2019 aglasem.com

No Result
View All Result
  • CBSE
  • ICSE / ISC
  • State Board
  • NCERT
  • Mock Test
  • Study Material
  • Olympiads
  • Schools Admission
  • Entrance Exams
  • Student Guide
  • HC Verma Solutions
  • Videos

© 2019 aglasem.com

Registration Open. ATSE 2022 Scholarship Apply Now!!