NCERT Solutions for Class 9 Social Science Chapter 9 The Price Puzzle What Drives the Market provide clear, step-by-step answers to every exercise and in-text question from the chapter The Price Puzzle What Drives the Market of the NCERT textbook Understanding Society: India and Beyond. Prepared by subject experts as per the latest NCERT (CBSE) syllabus for 2026-27, these NCERT Solutions for Class 9 Social Science help you understand each concept, write exam-ready answers, and check your own solutions. You can read them online below or download the free Class 9 Social Science Chapter 9 question-answer PDF.
NCERT Solutions for Class 9 Social Science Chapter 9 The Price Puzzle What Drives the Market
- Class: Class 9
- Subject: Social Science
- Chapter: Chapter 9 – The Price Puzzle What Drives the Market
- Textbook: Understanding Society: India and Beyond (NCERT)
- Study material: NCERT Solutions – questions with answers, free PDF
These solutions answer all the exercise questions of Chapter 9 The Price Puzzle What Drives the Market — including the in-text questions, short-answer and long-answer questions, and activities — with complete explanations so you can follow the method, not just the final answer. Read the full solutions below.
NCERT Solutions Class 9 Social Science Chapter 9 the Price Puzzle What Drives the Market View Download
NCERT Solutions for Class 9 Social Science Chapter 9 PDF Download
You can read the NCERT Solutions for Class 9 Social Science Chapter 9 online above, or download the complete question-answer PDF to study The Price Puzzle What Drives the Market offline at any time.
NCERT Solutions for Class 9 Social Science Chapter 9 PDF Download Link – Click Here to Download Solutions PDF
Questions Covered in This Chapter
These NCERT Solutions answer all 44 questions of this chapter. The questions solved are:
- What are the factors that influence the demand for and supply of goods and services in a market?
- How are prices of goods and services determined through demand and supply interactions?
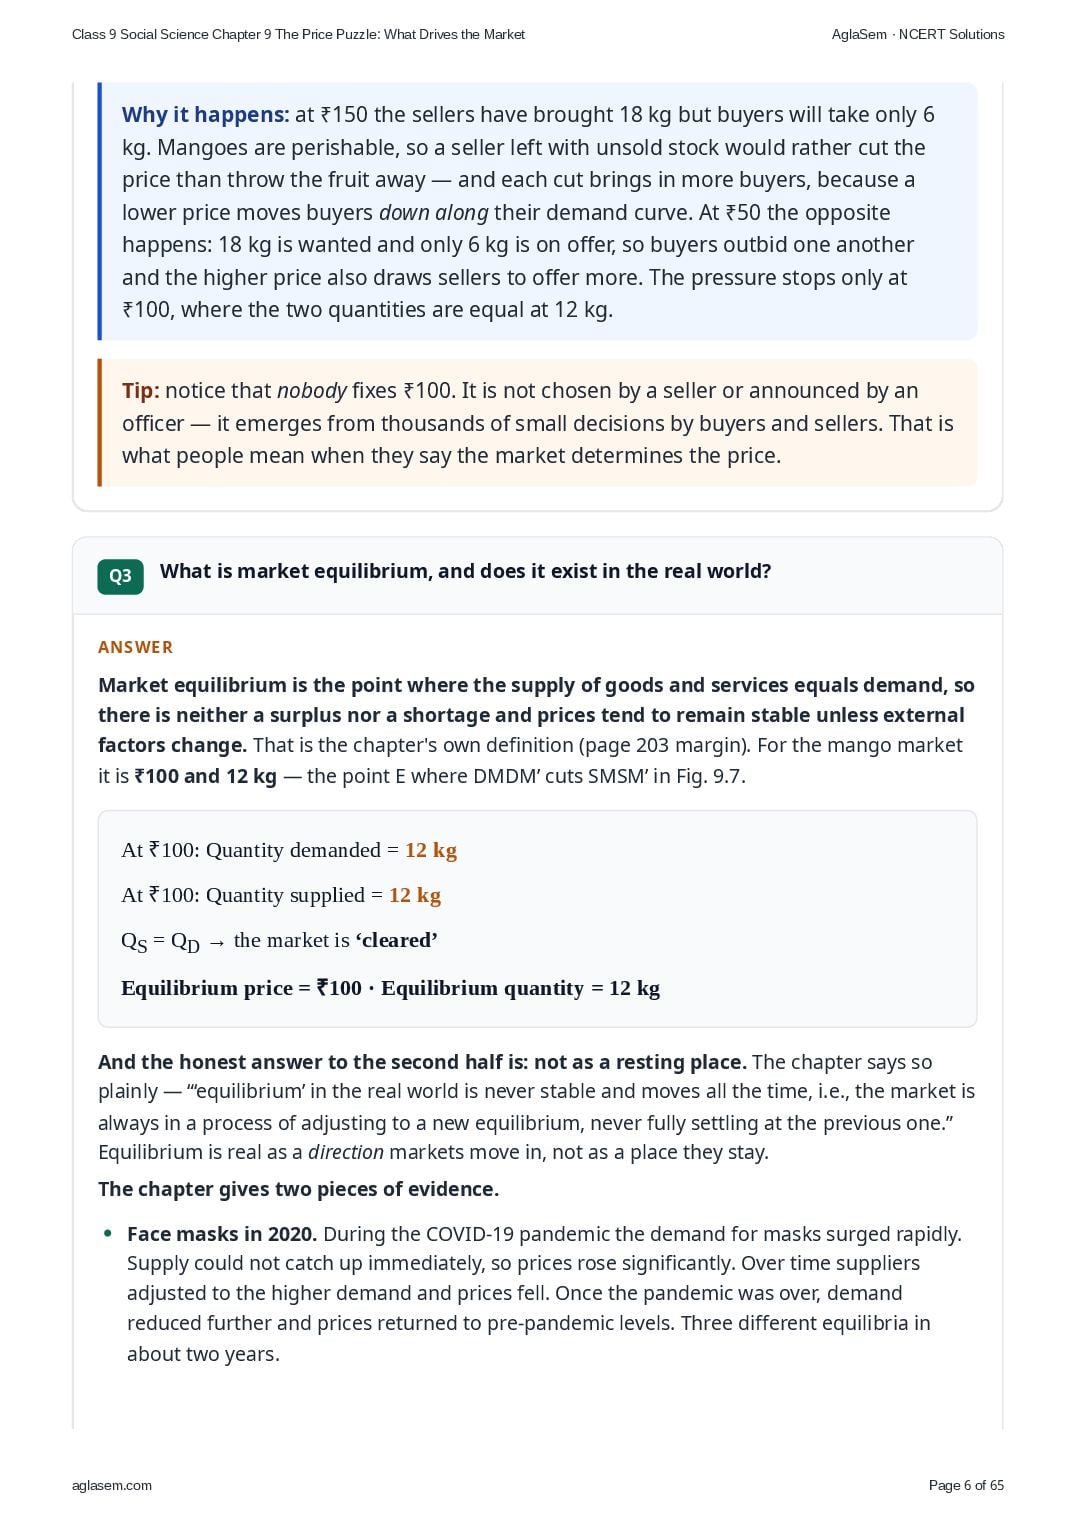
- What is market equilibrium, and does it exist in the real world?
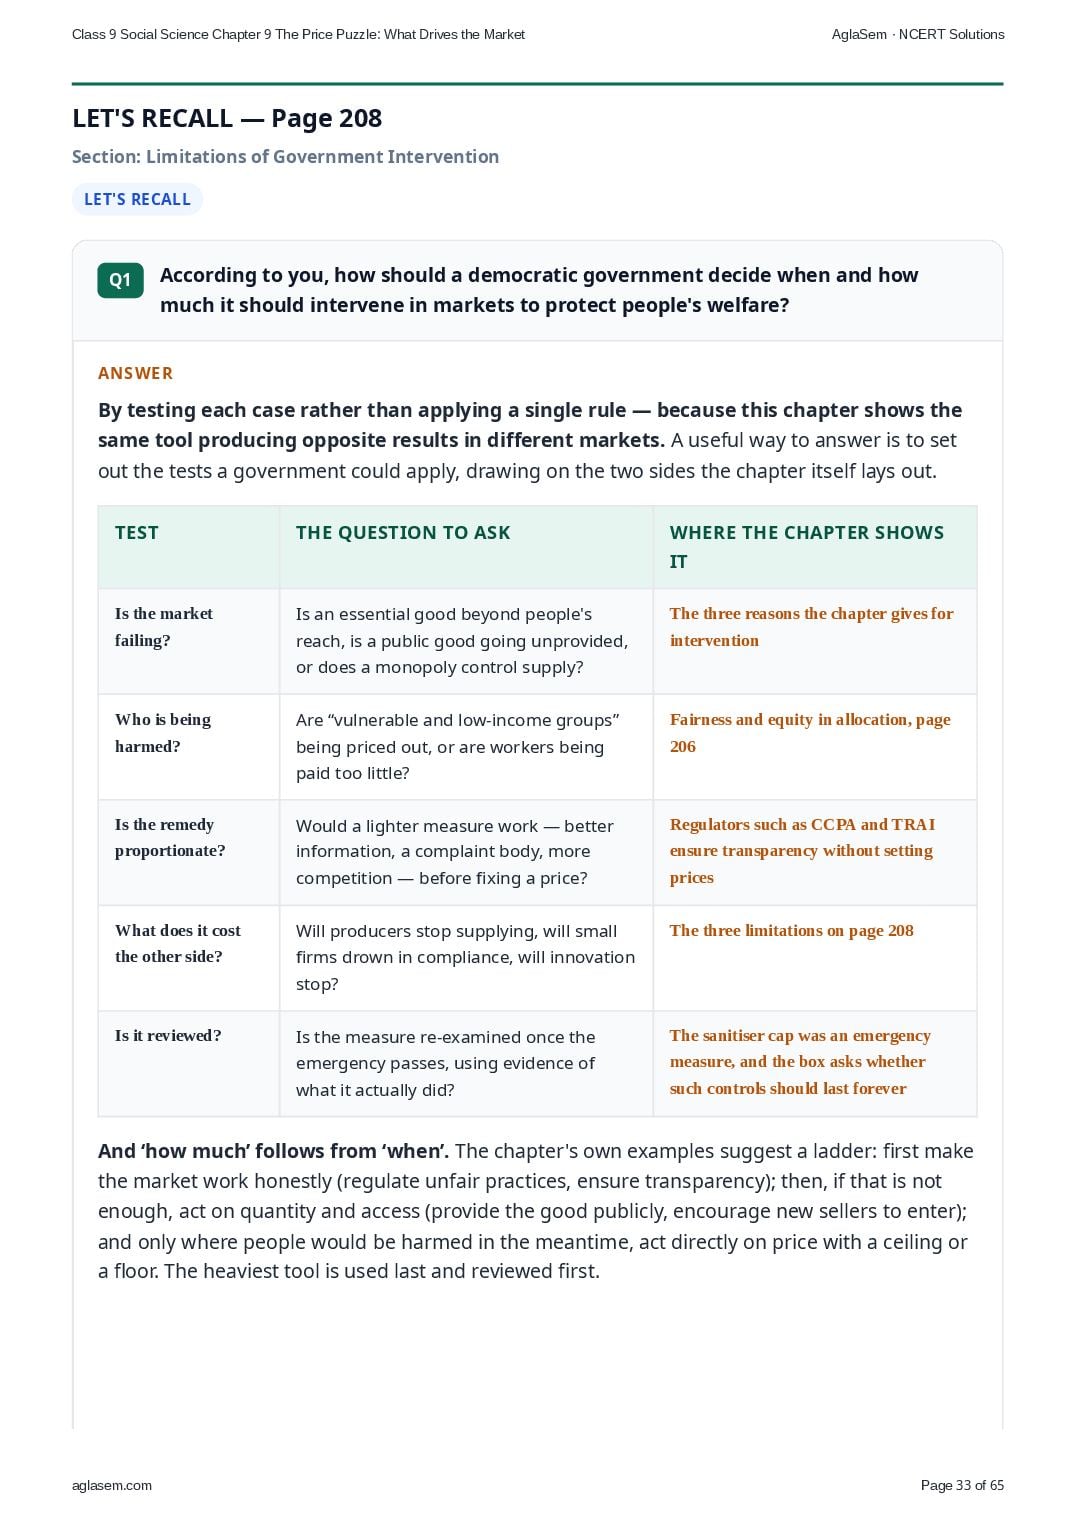
- How and why does the government intervene in the market?
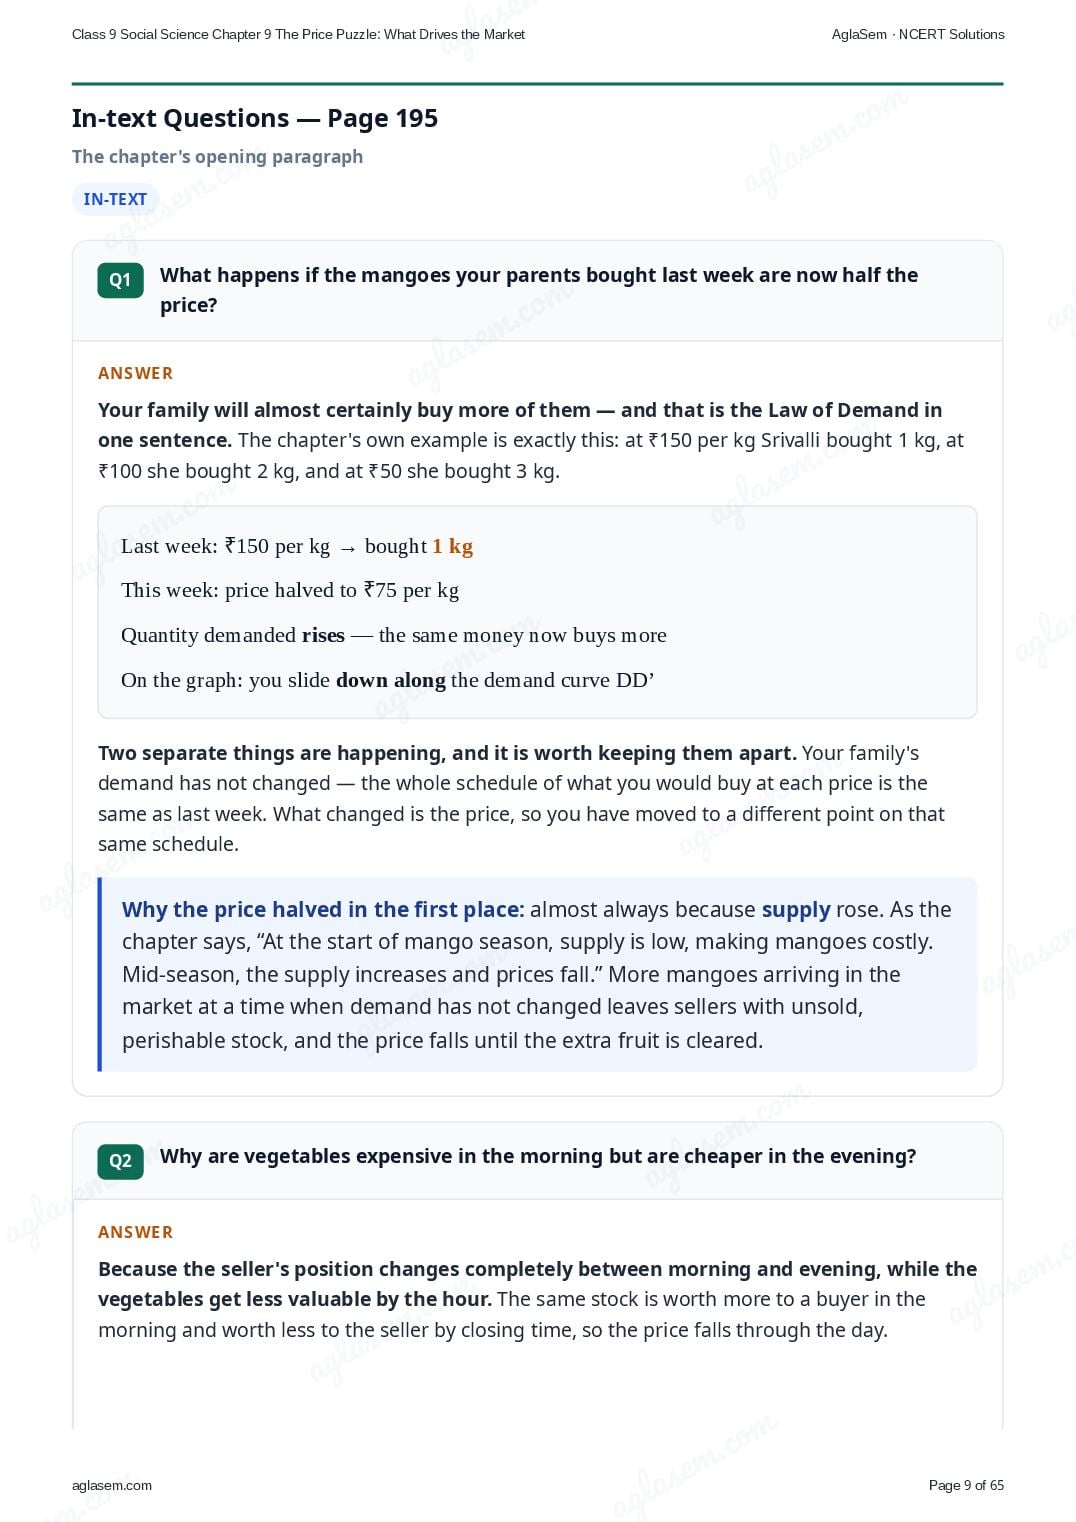
- What happens if the mangoes your parents bought last week are now half the price?
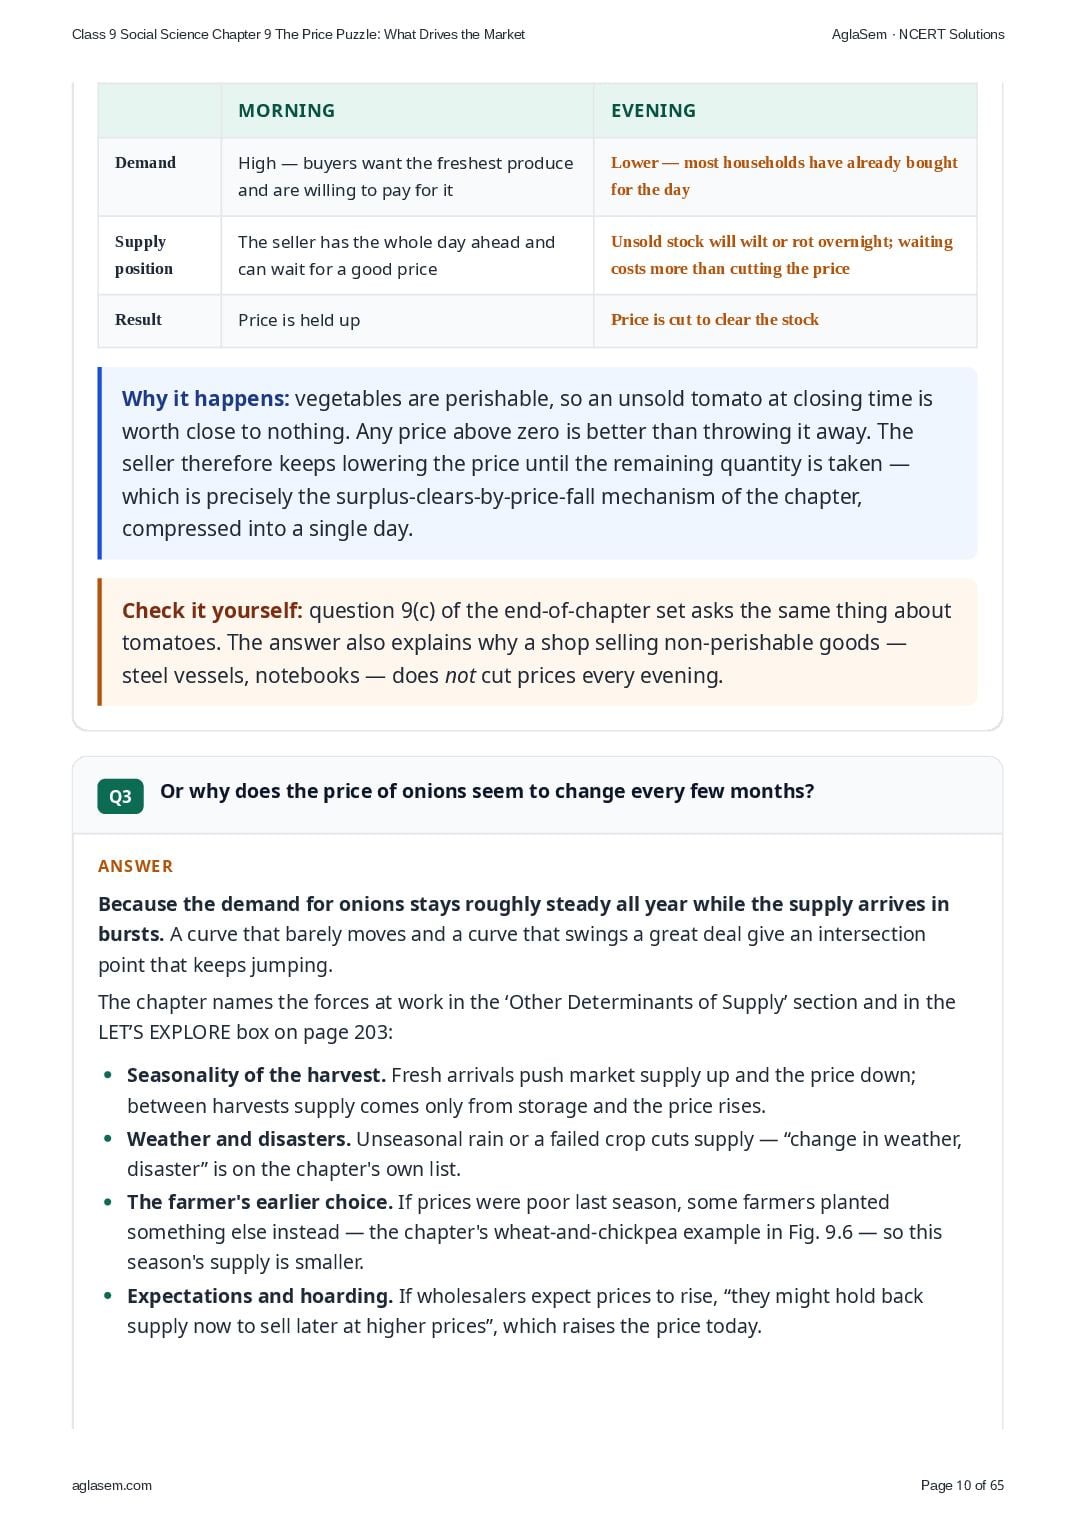
- Why are vegetables expensive in the morning but are cheaper in the evening?
- Or why does the price of onions seem to change every few months?
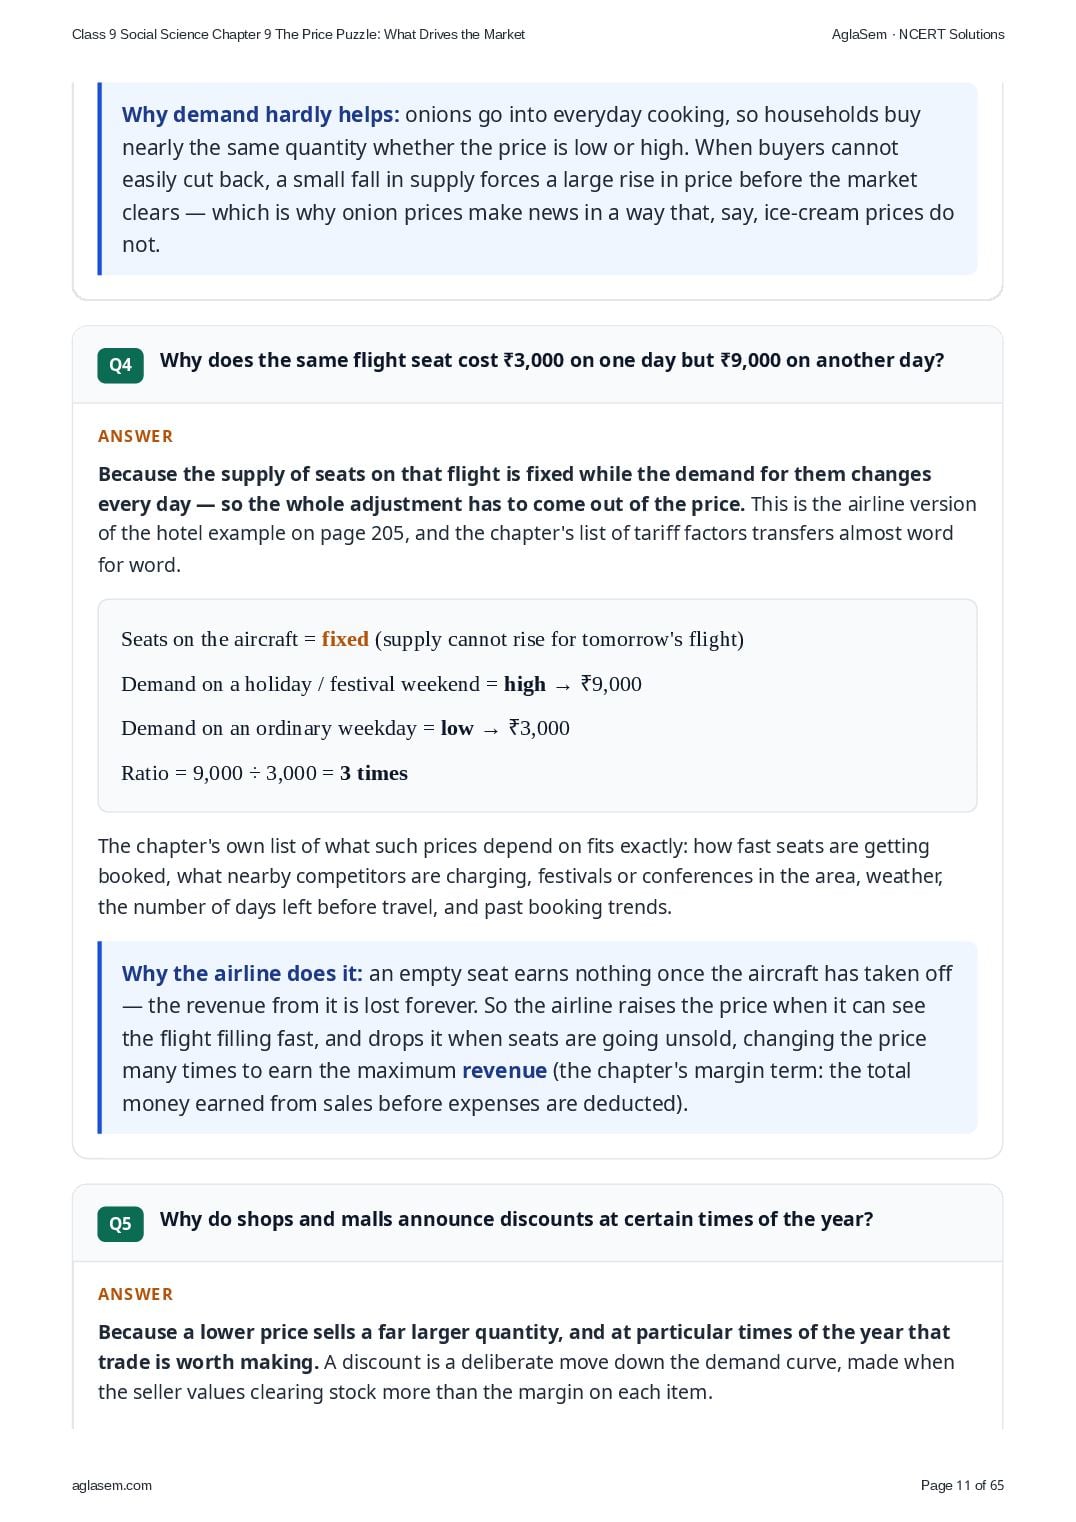
- Why does the same flight seat cost ₹3,000 on one day but ₹9,000 on another day?
- Why do shops and malls announce discounts at certain times of the year?
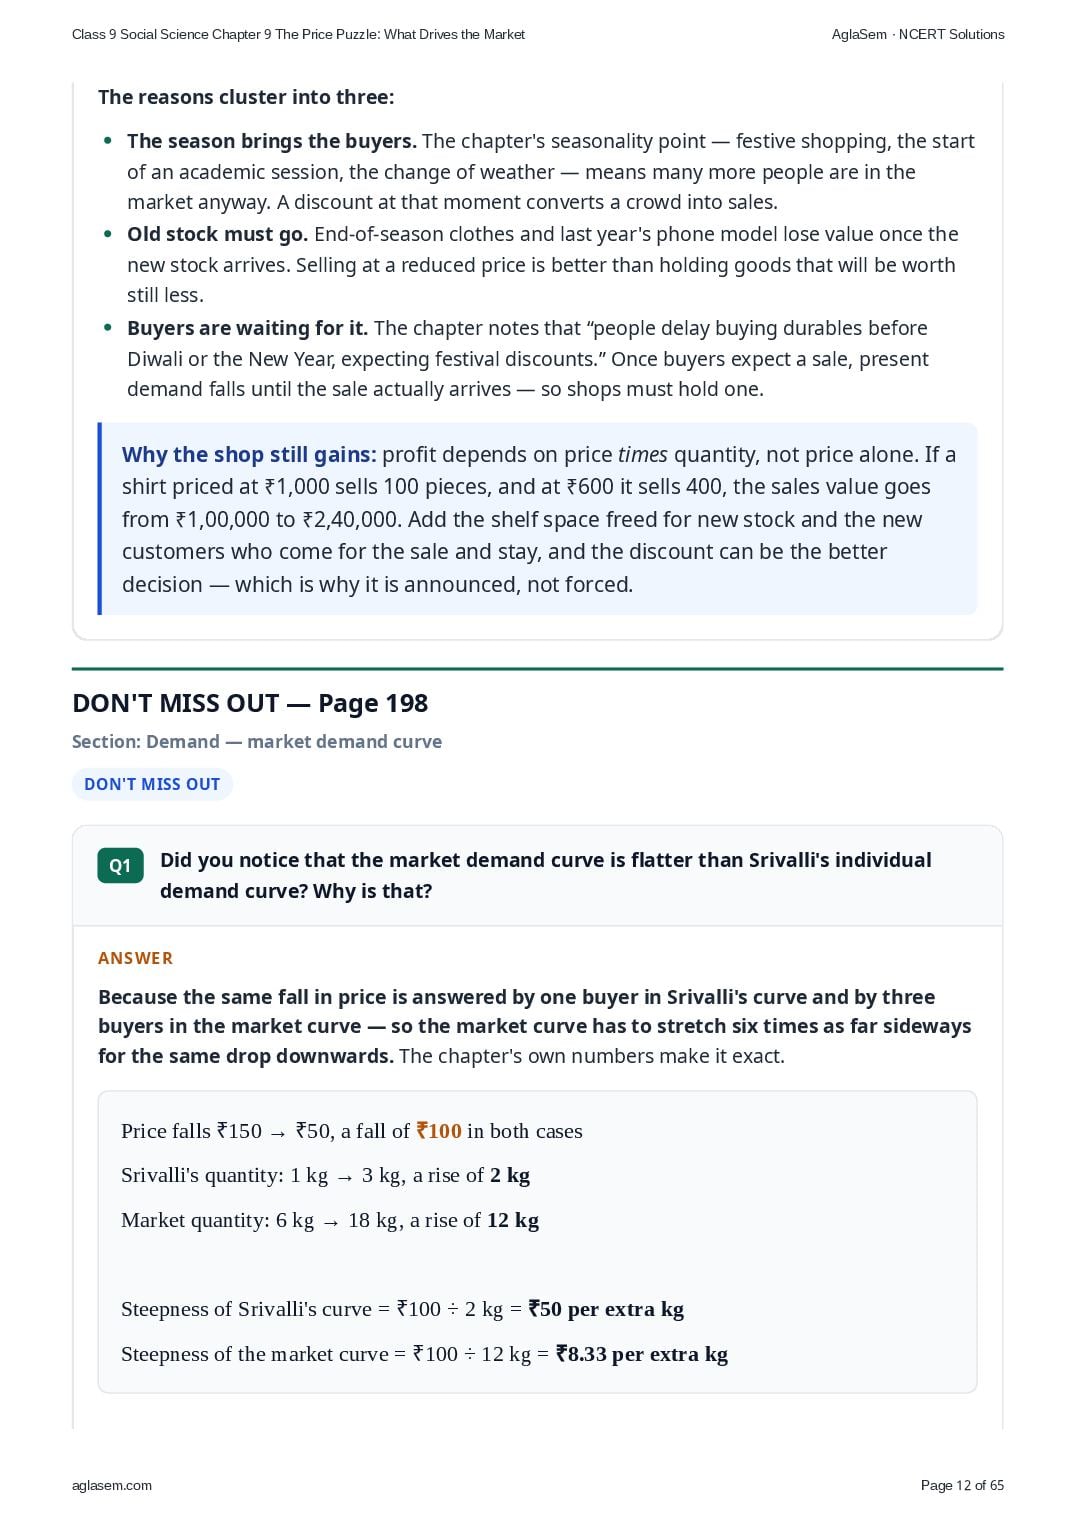
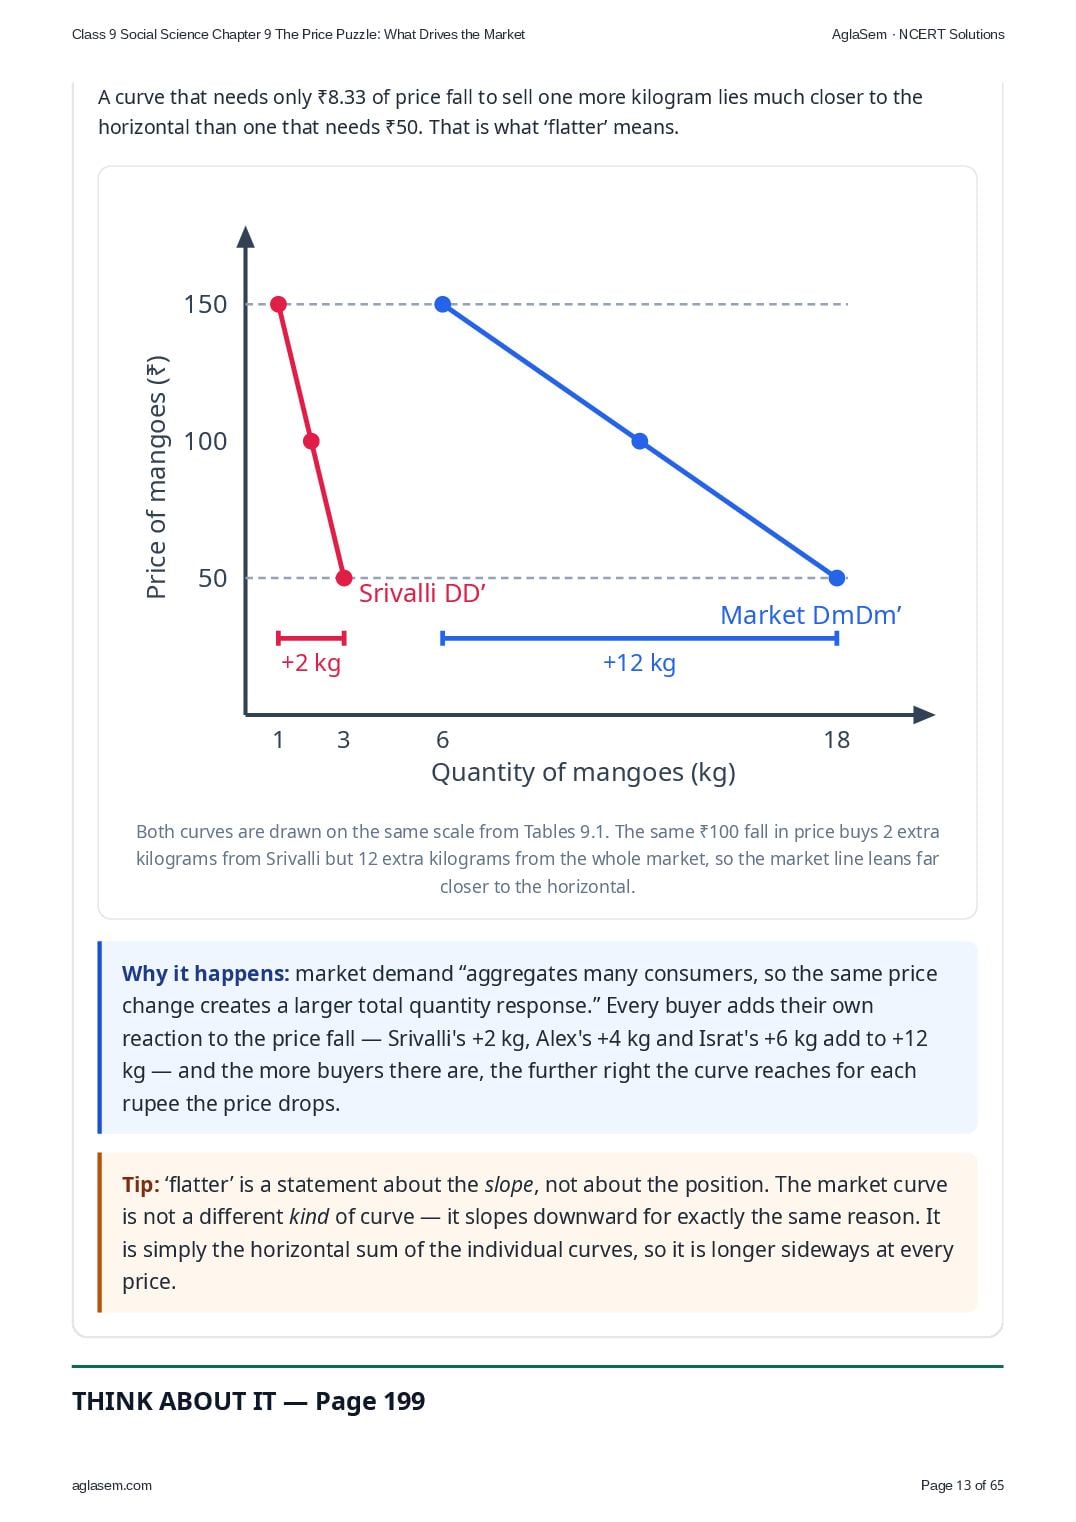
- Did you notice that the market demand curve is flatter than Srivalli's individual demand curve? Why is that?
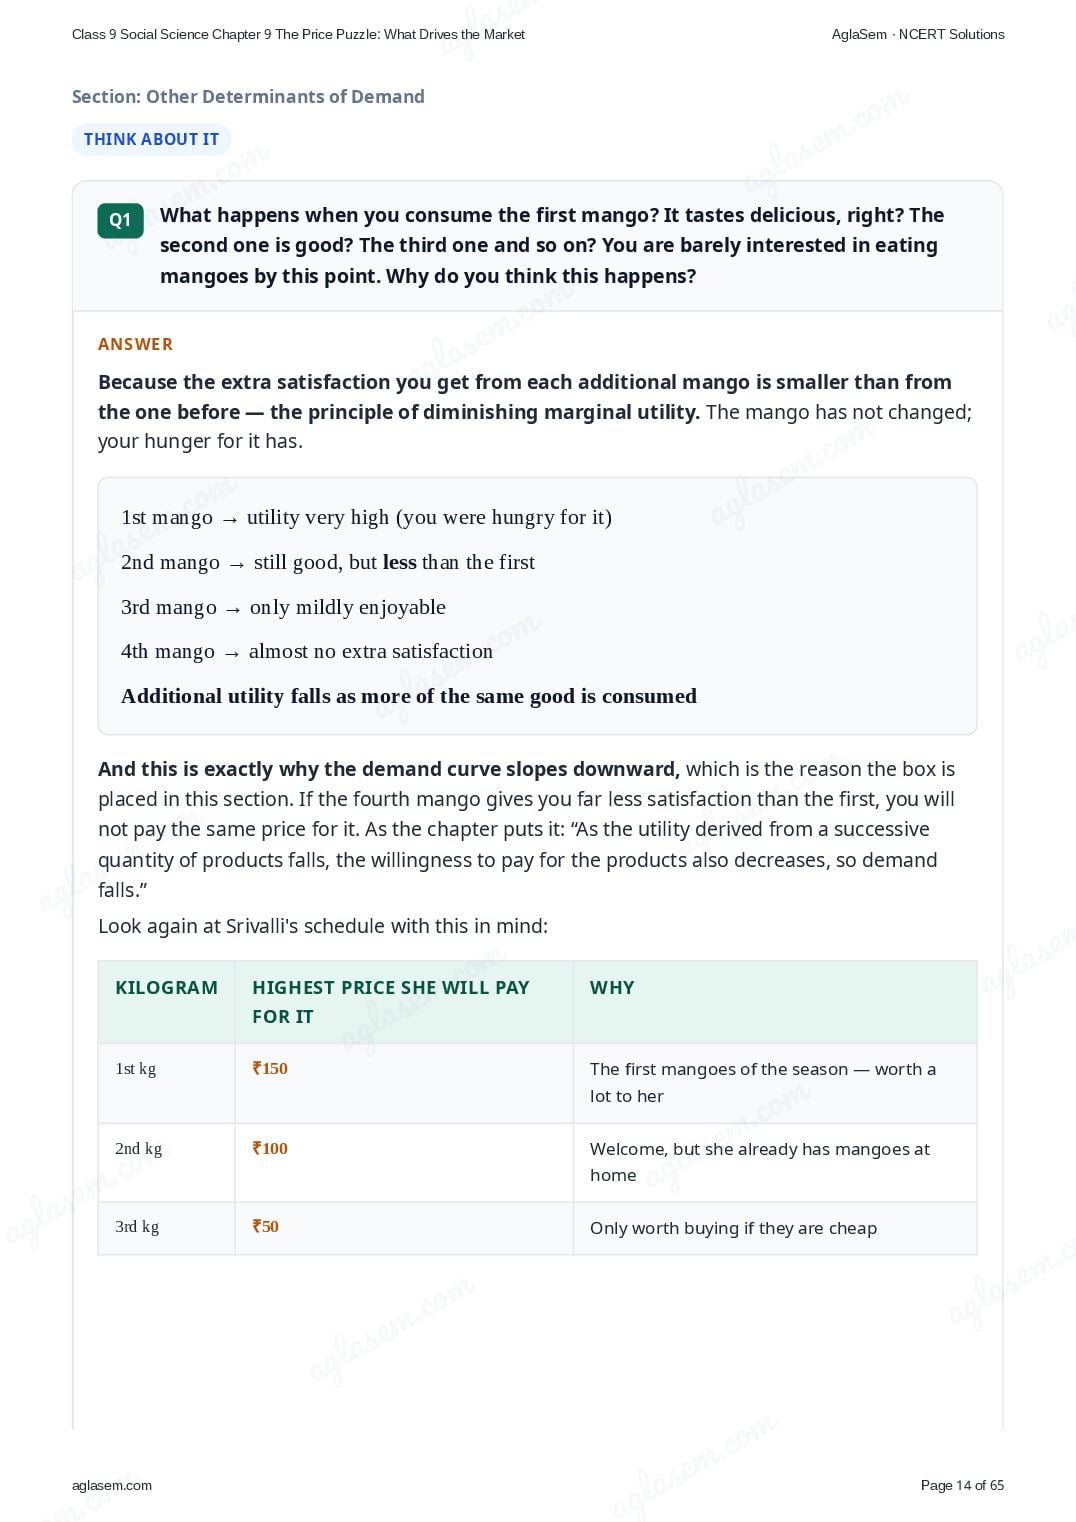
- What happens when you consume the first mango? It tastes delicious, right? The second one is good? The third one and so on? You are barely interested in eating mangoes by this point. Why do you think this happens?
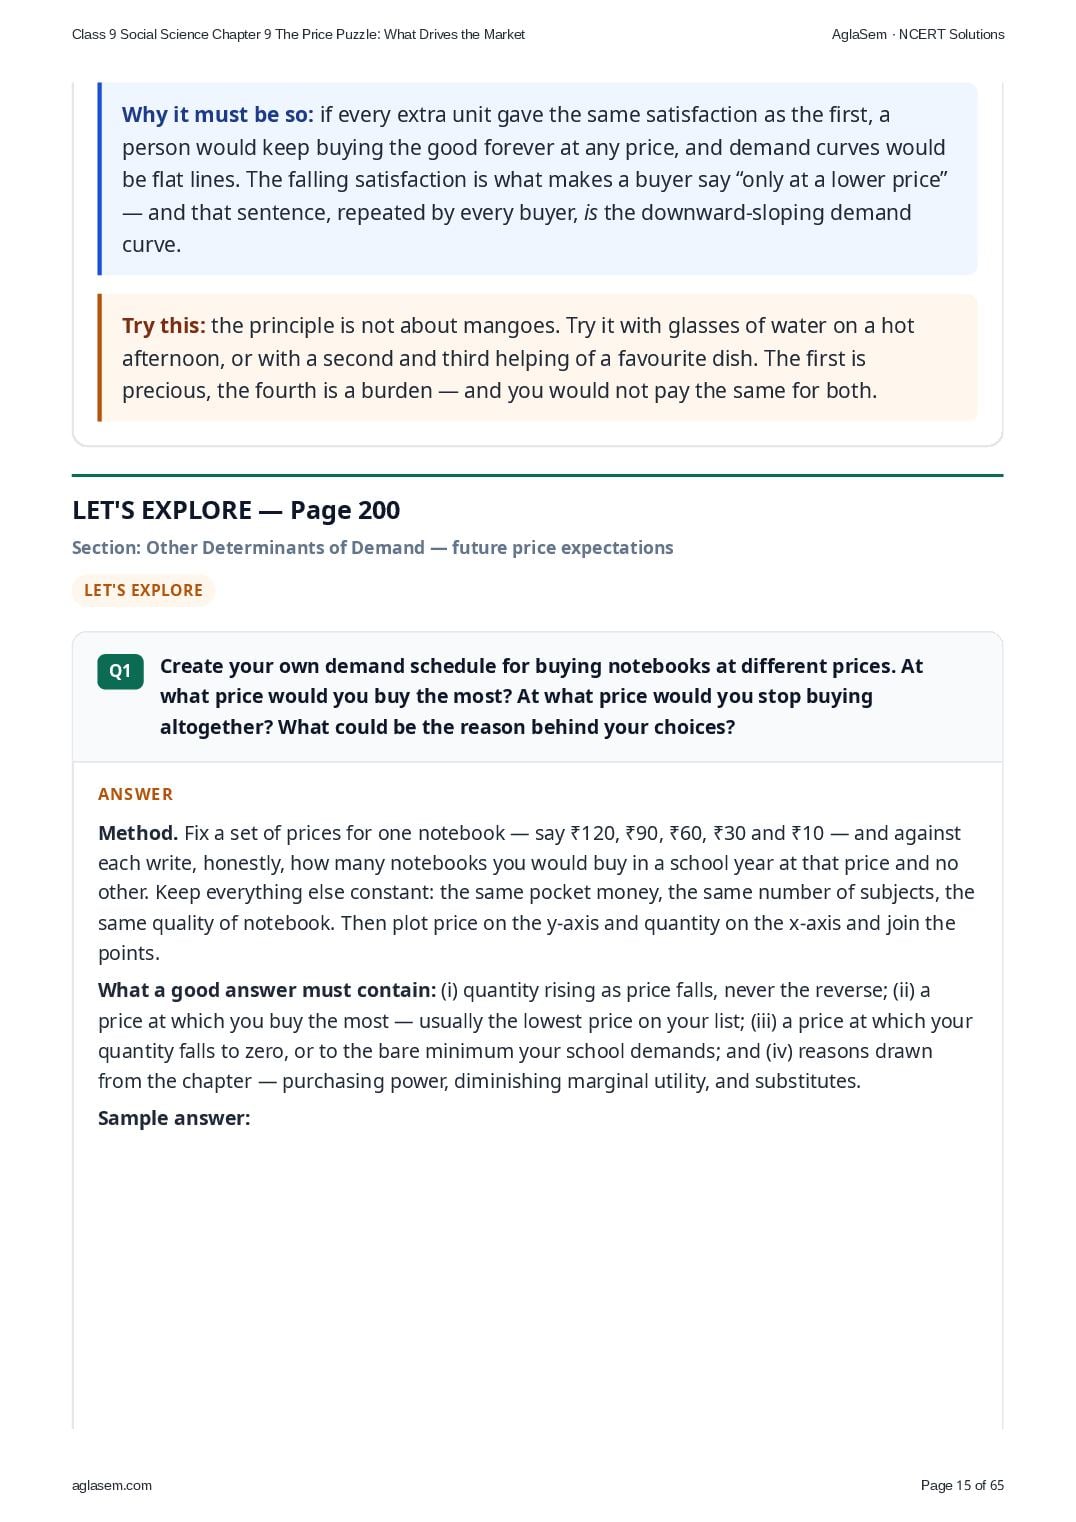
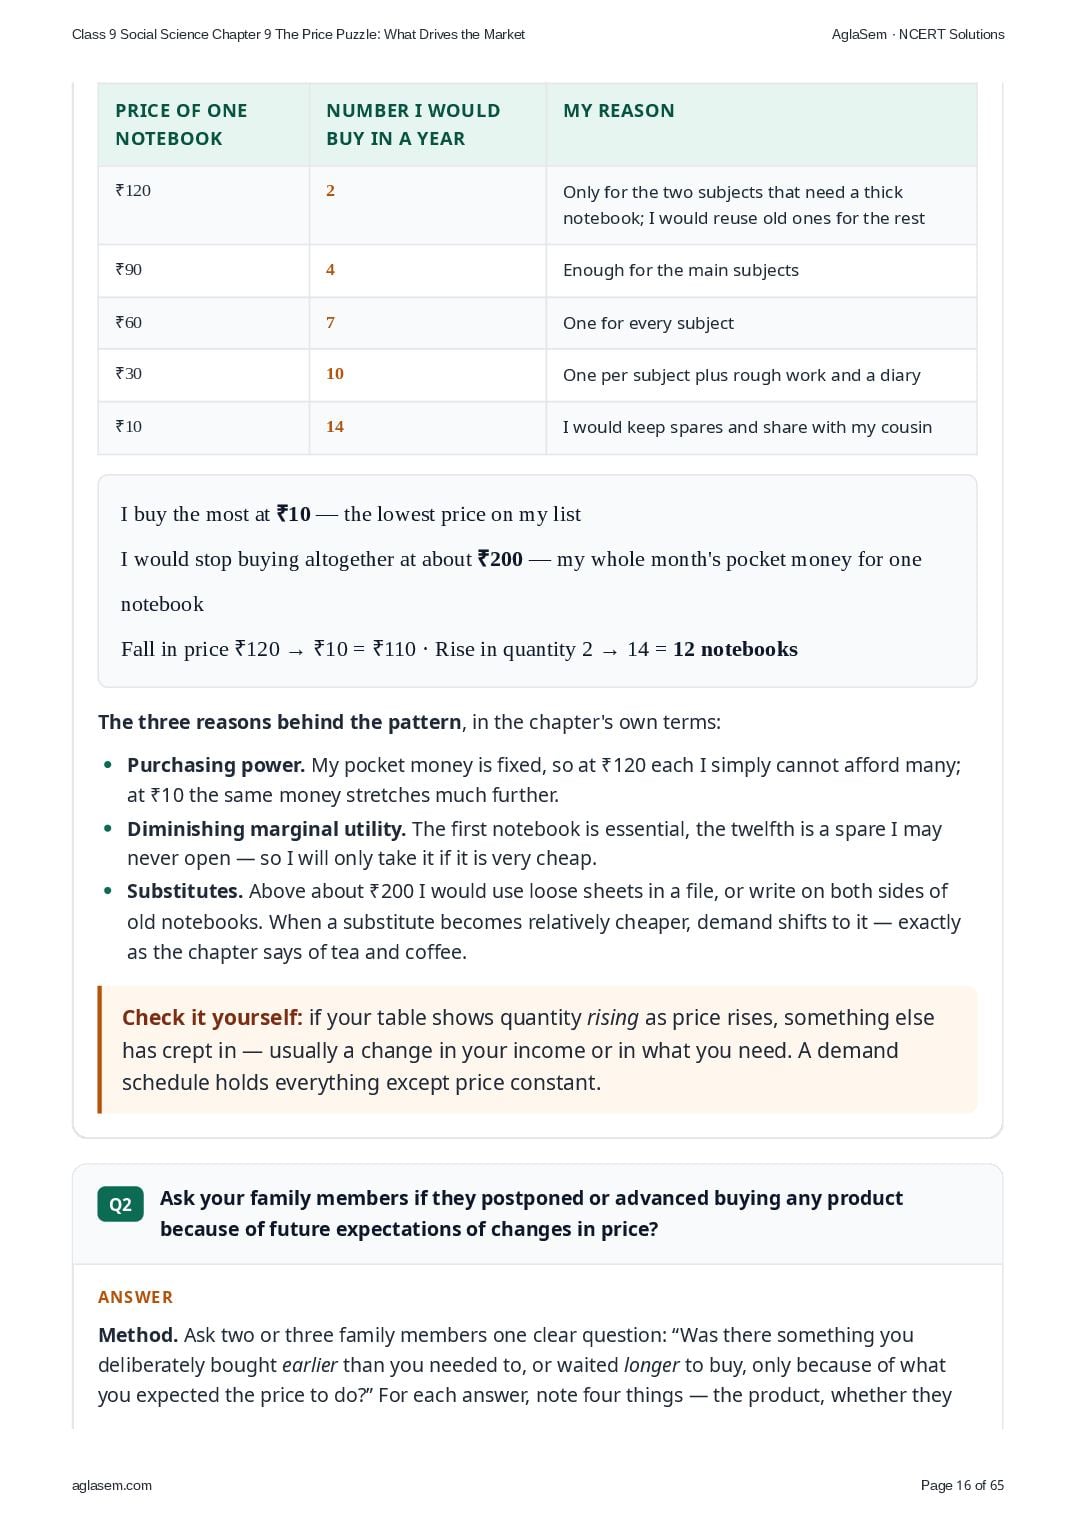
- Create your own demand schedule for buying notebooks at different prices. At what price would you buy the most? At what price would you stop buying altogether? What could be the reason behind your choices?
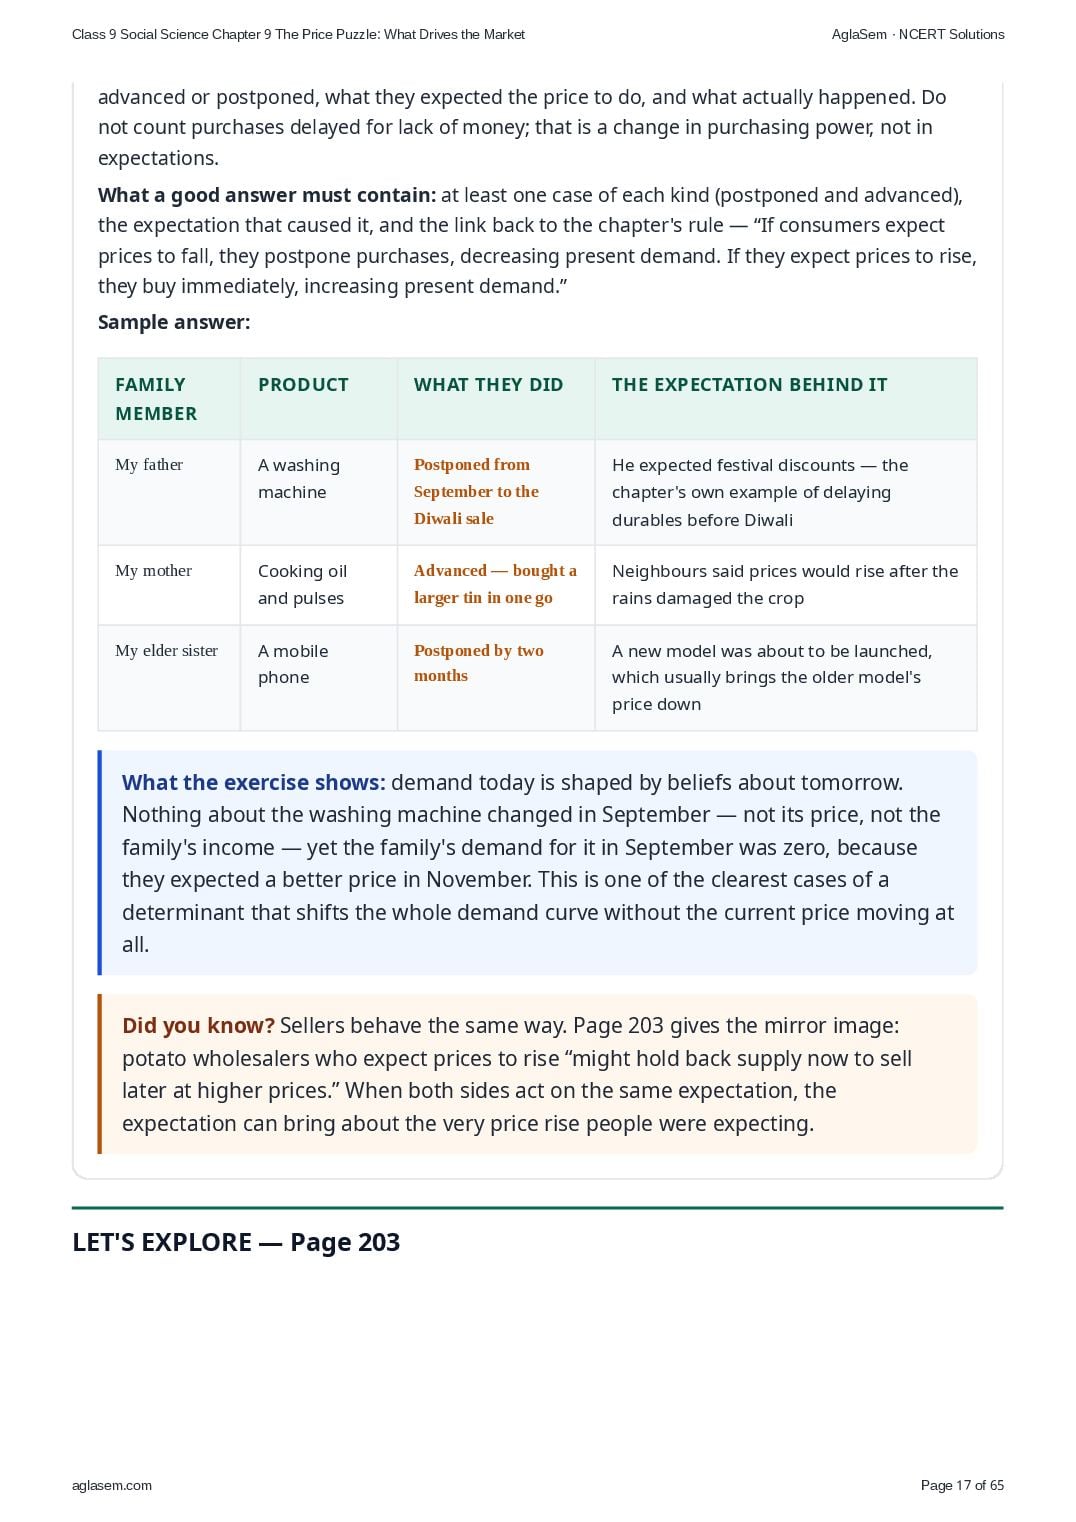
- Ask your family members if they postponed or advanced buying any product because of future expectations of changes in price?
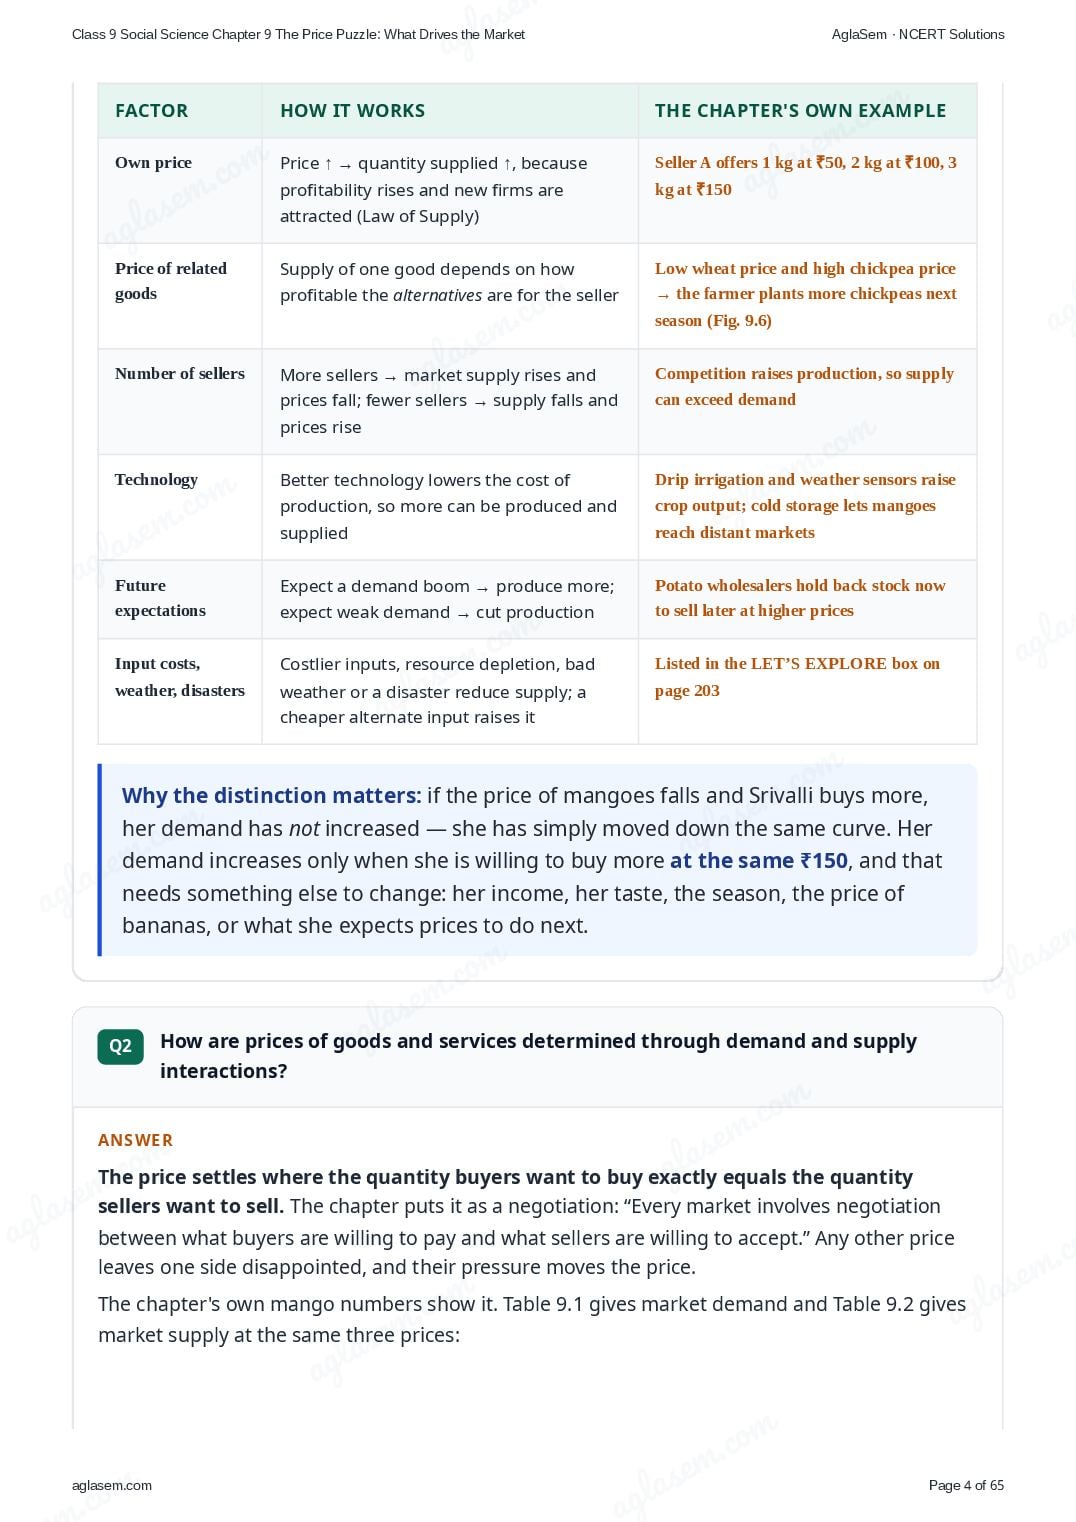
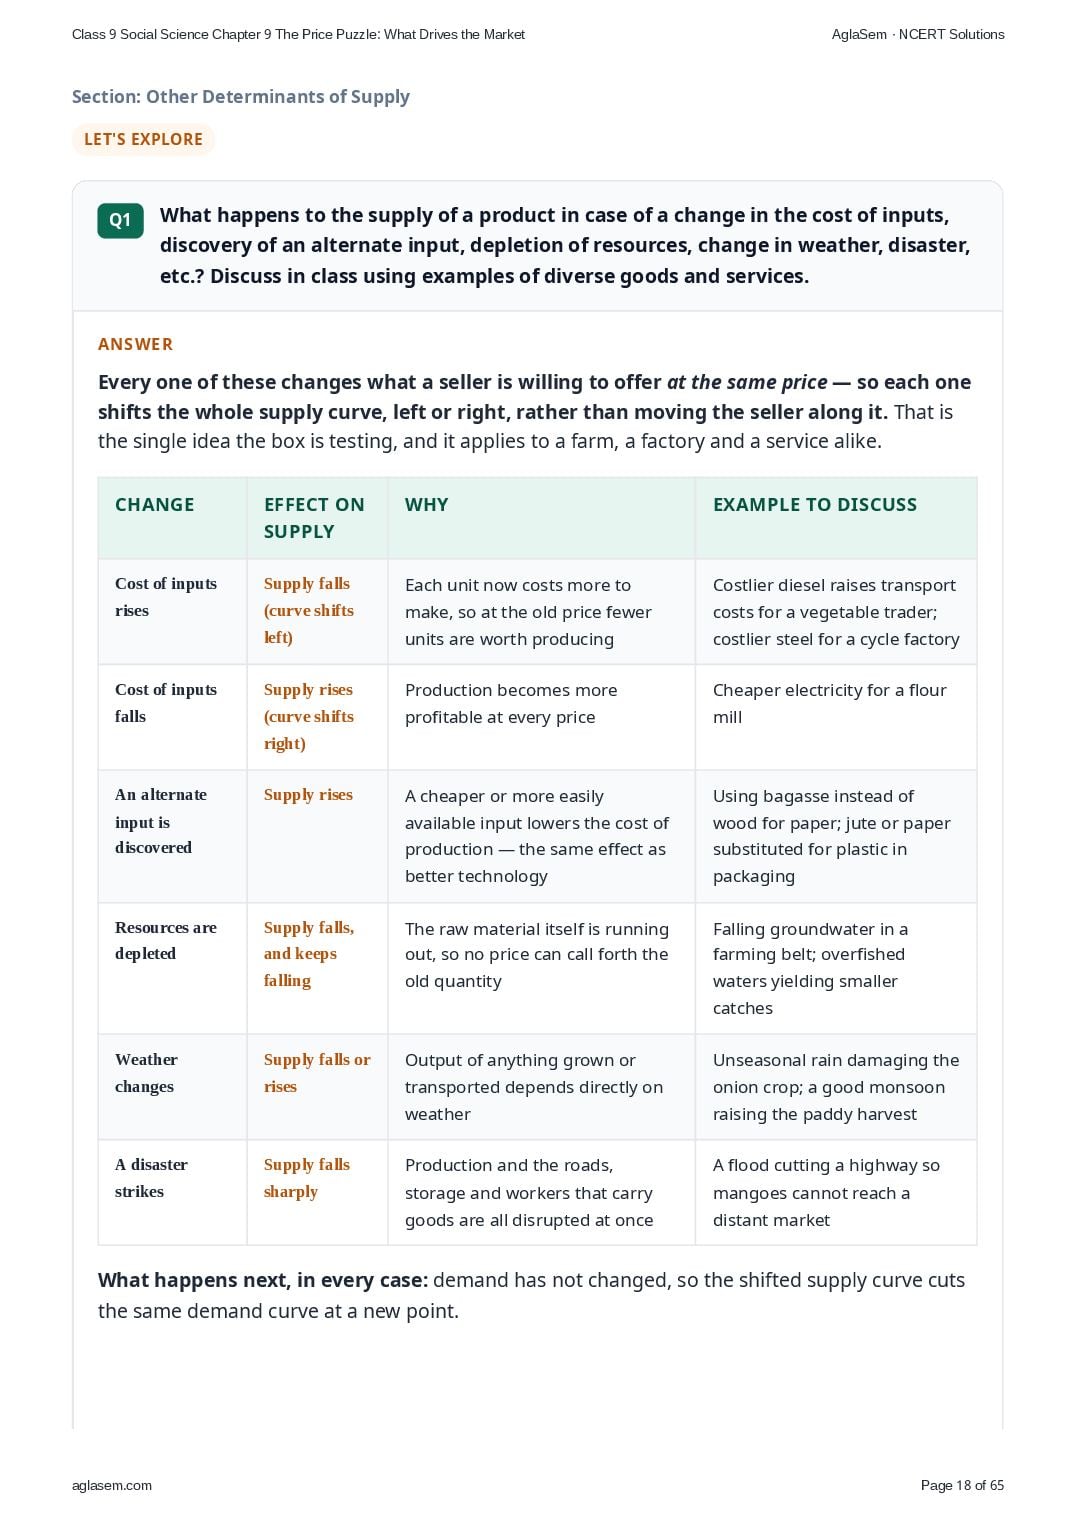
- What happens to the supply of a product in case of a change in the cost of inputs, discovery of an alternate input, depletion of resources, change in weather, disaster, etc.? Discuss in class using examples of diverse goods and services.
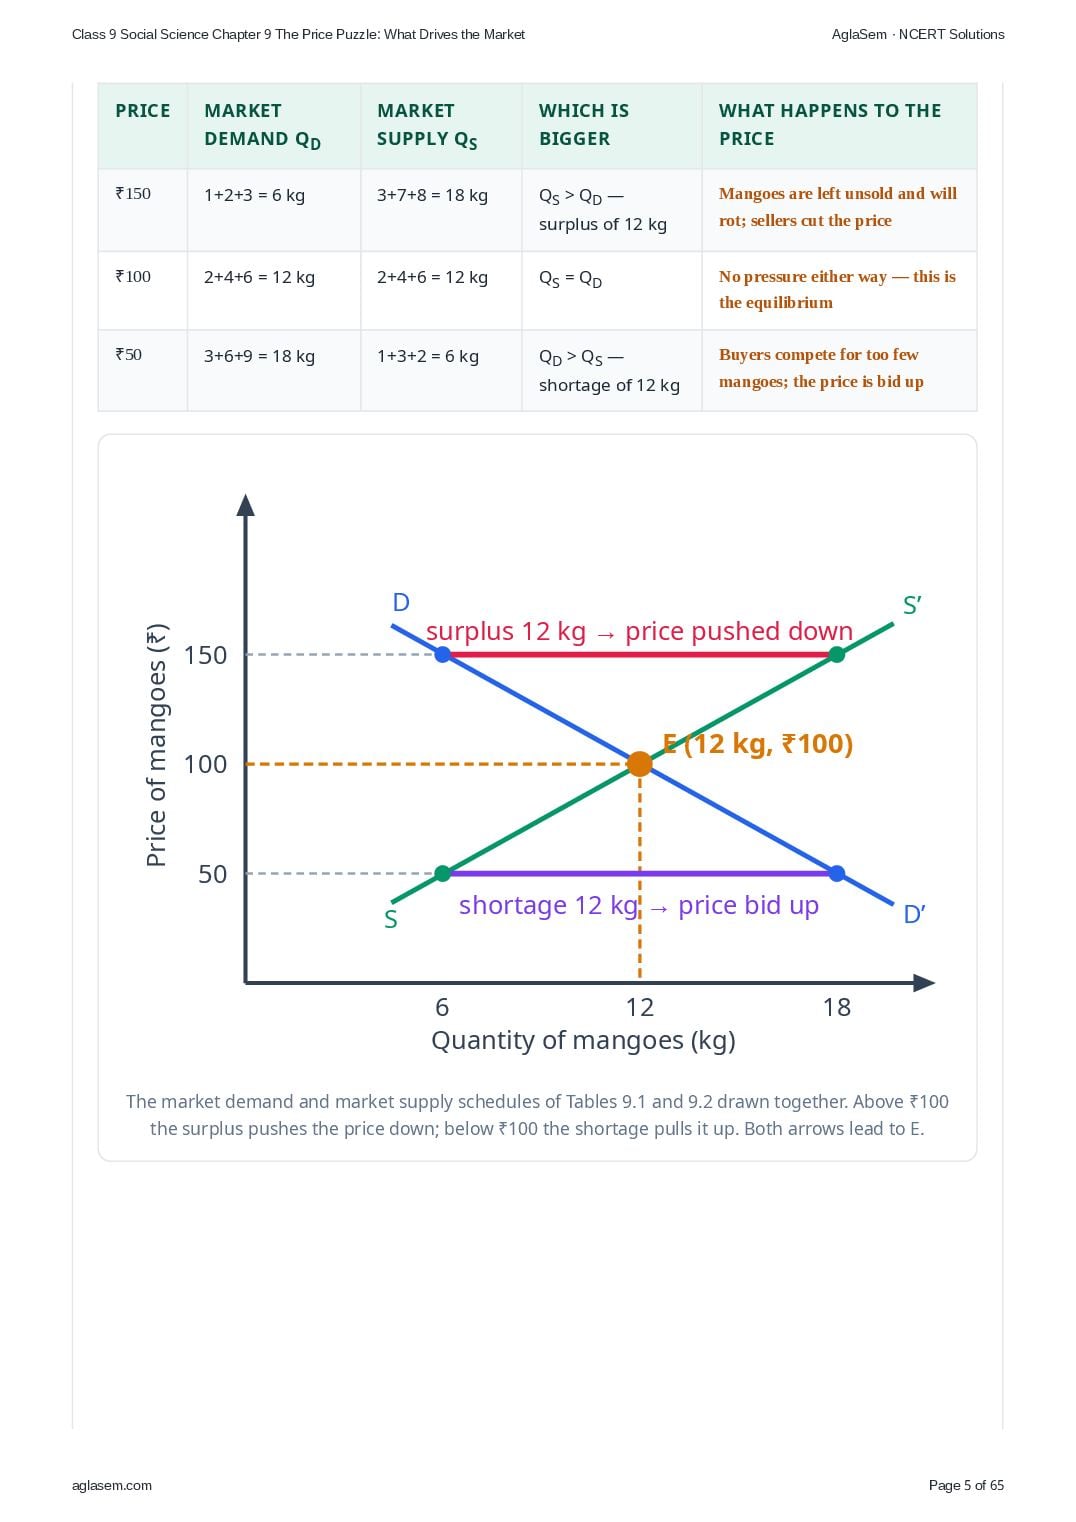
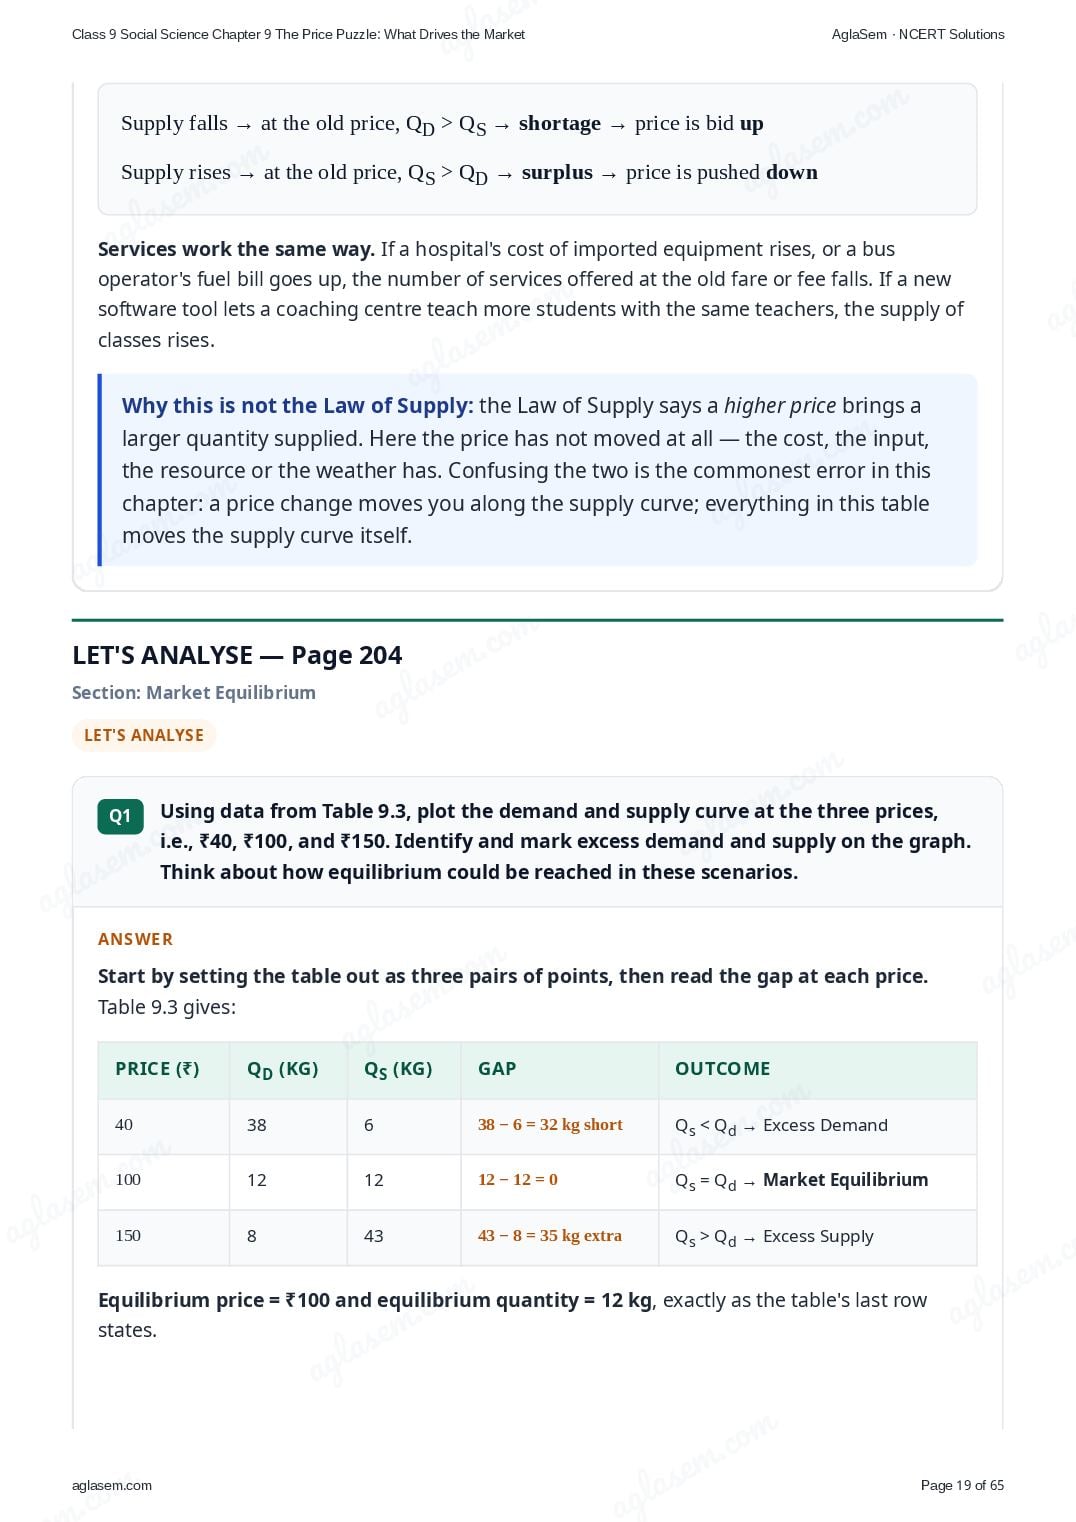
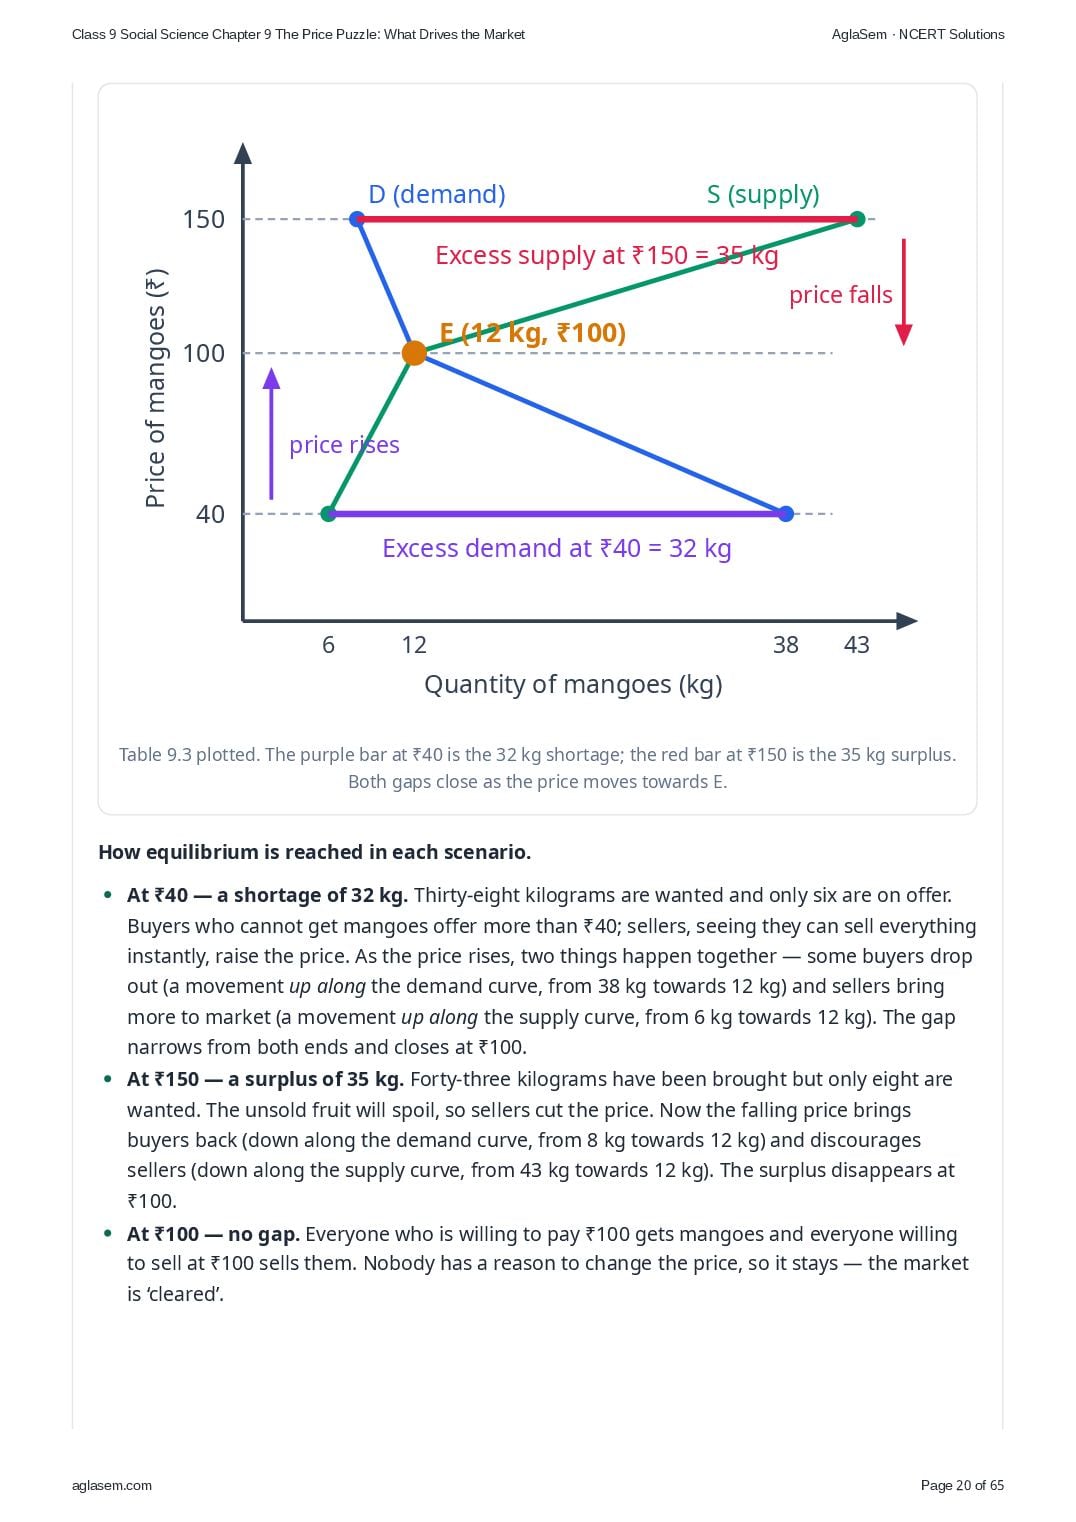
- Using data from Table 9.3, plot the demand and supply curve at the three prices, i.e., ₹40, ₹100, and ₹150. Identify and mark excess demand and supply on the graph. Think about how equilibrium could be reached in these scenarios.
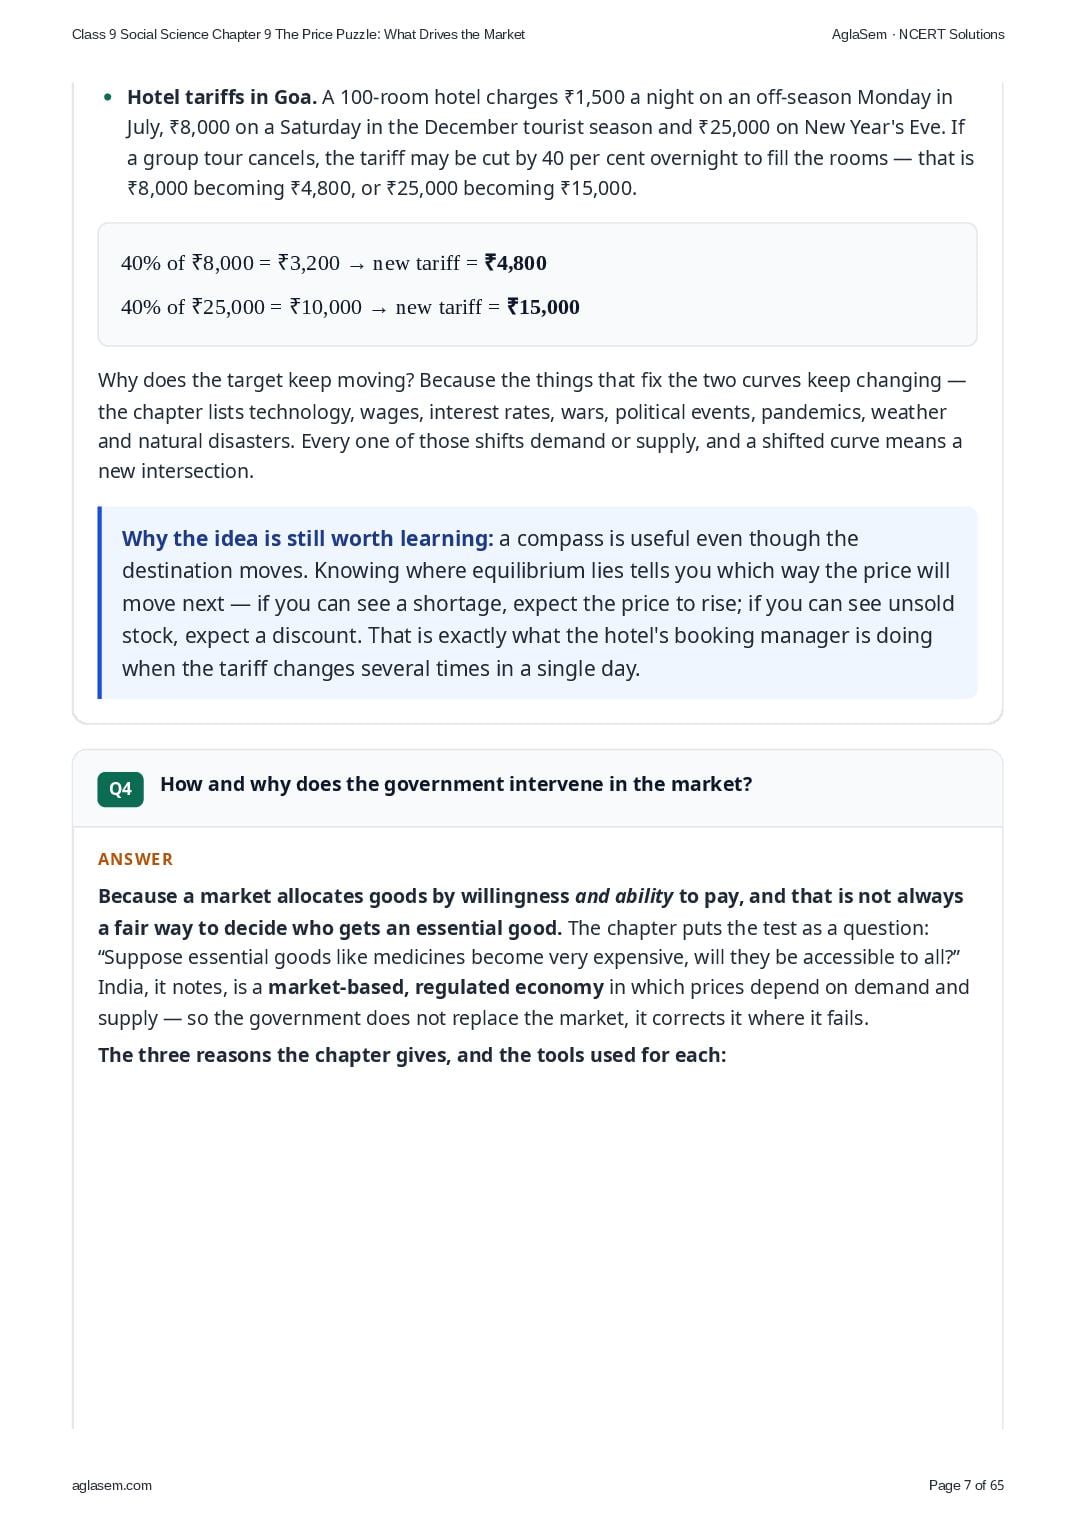
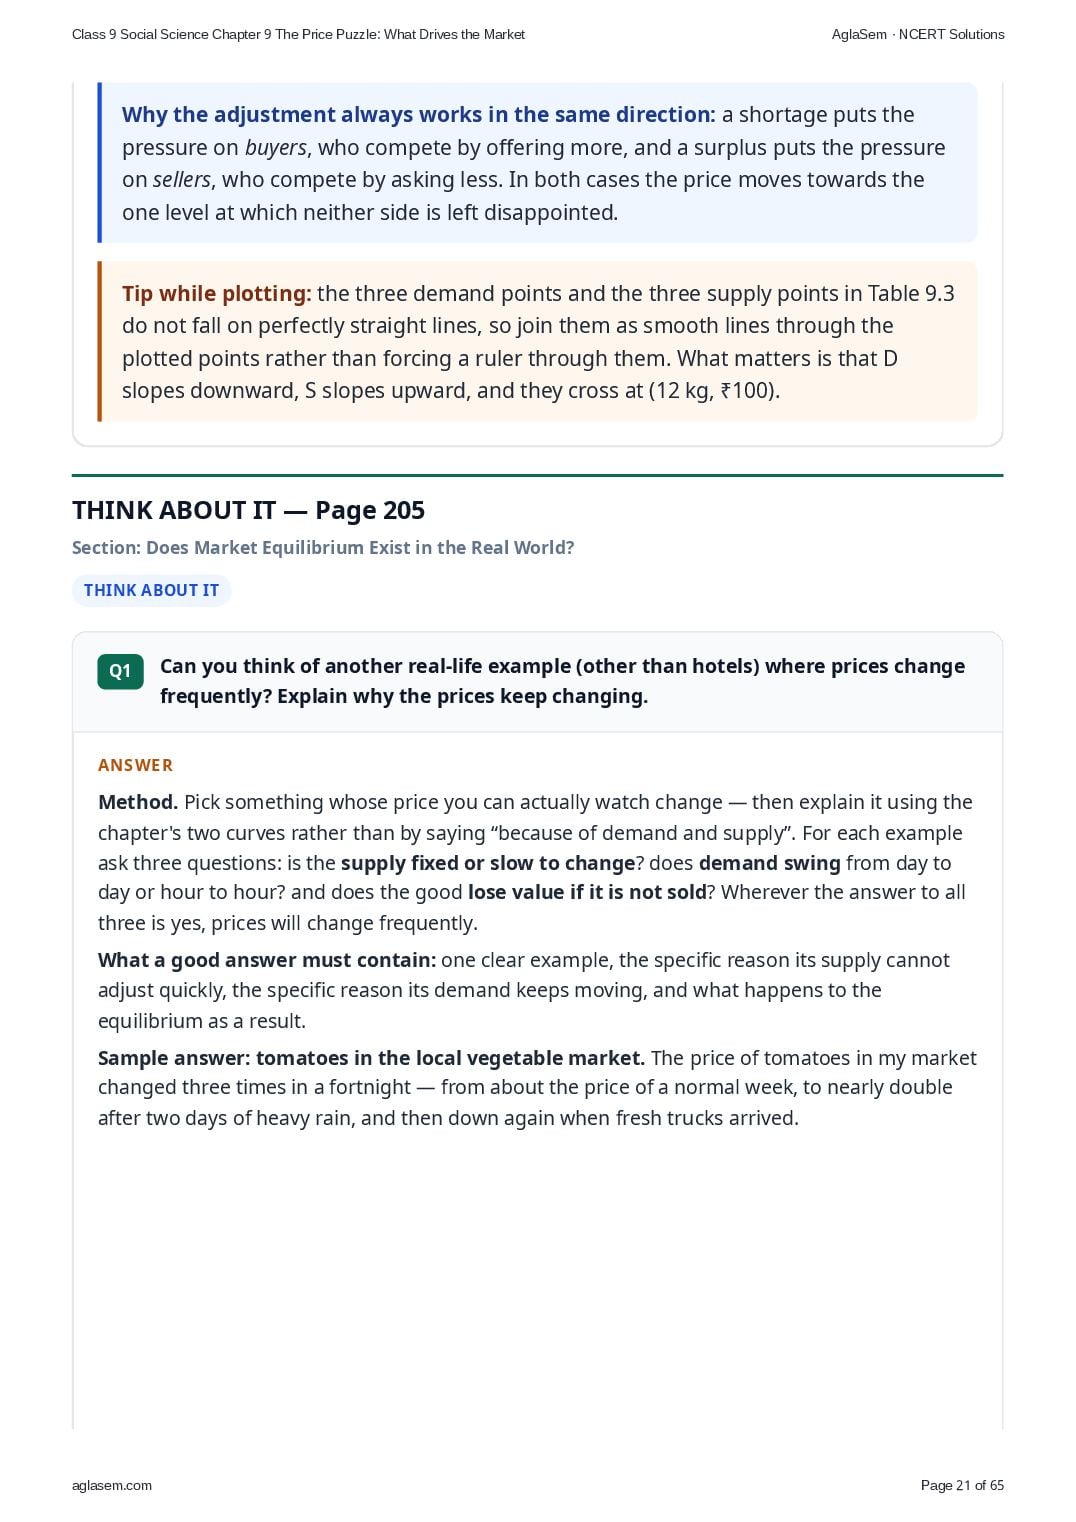
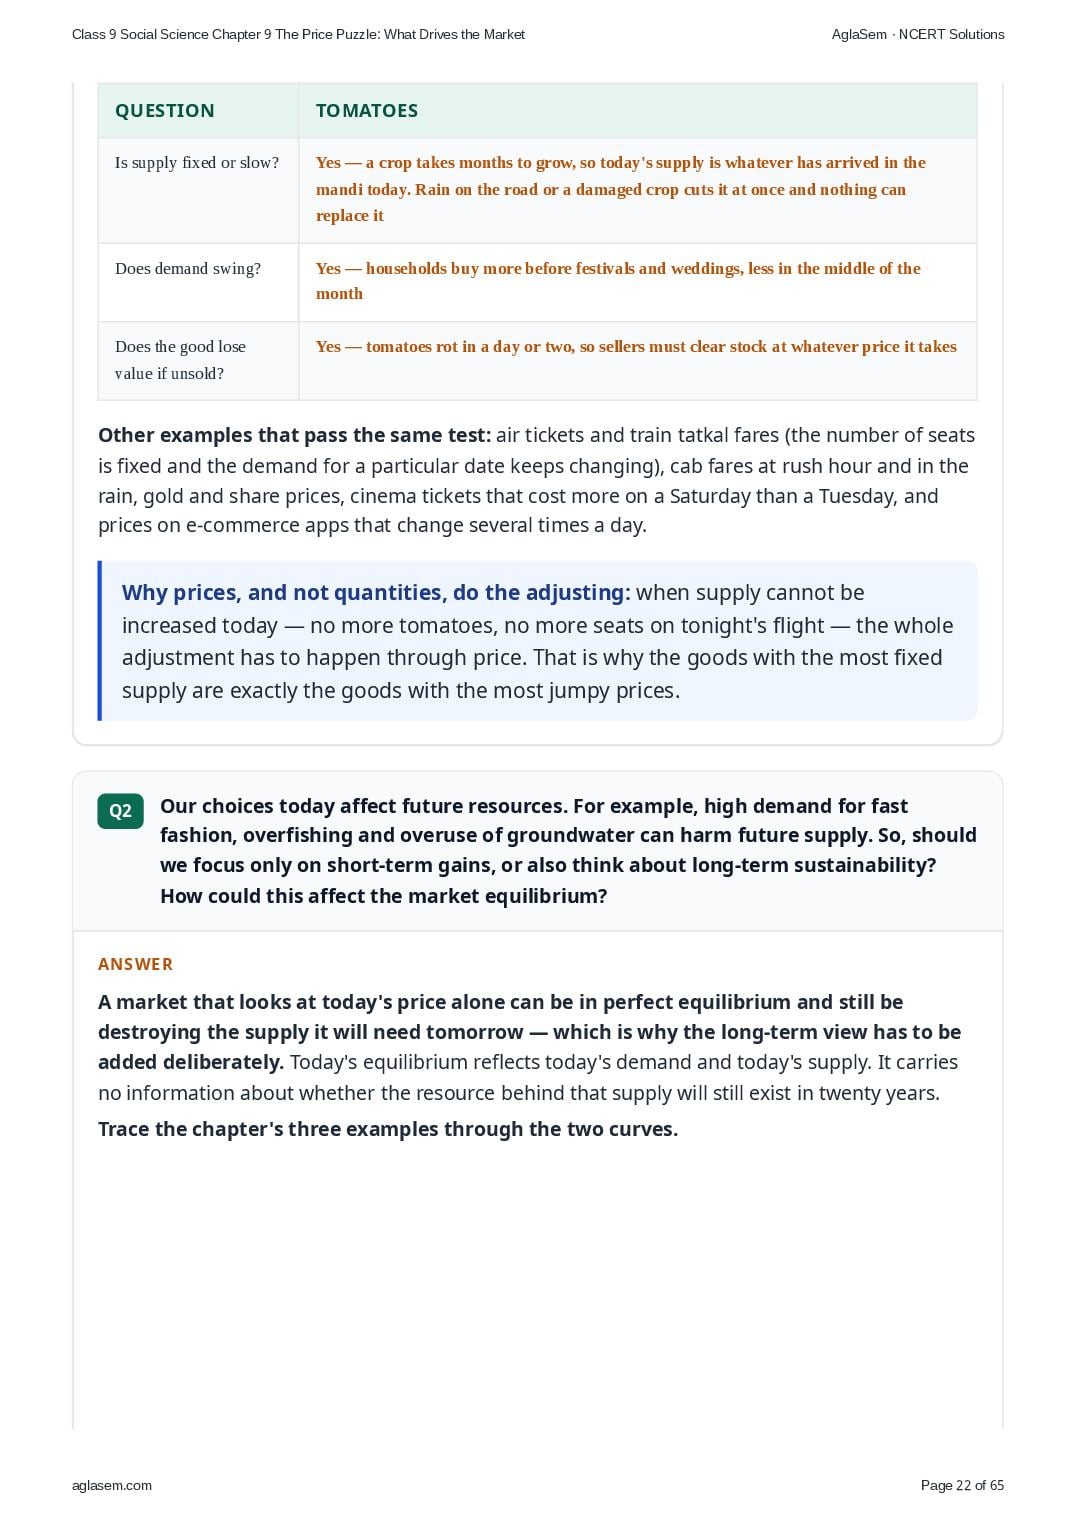
- Can you think of another real-life example (other than hotels) where prices change frequently? Explain why the prices keep changing.
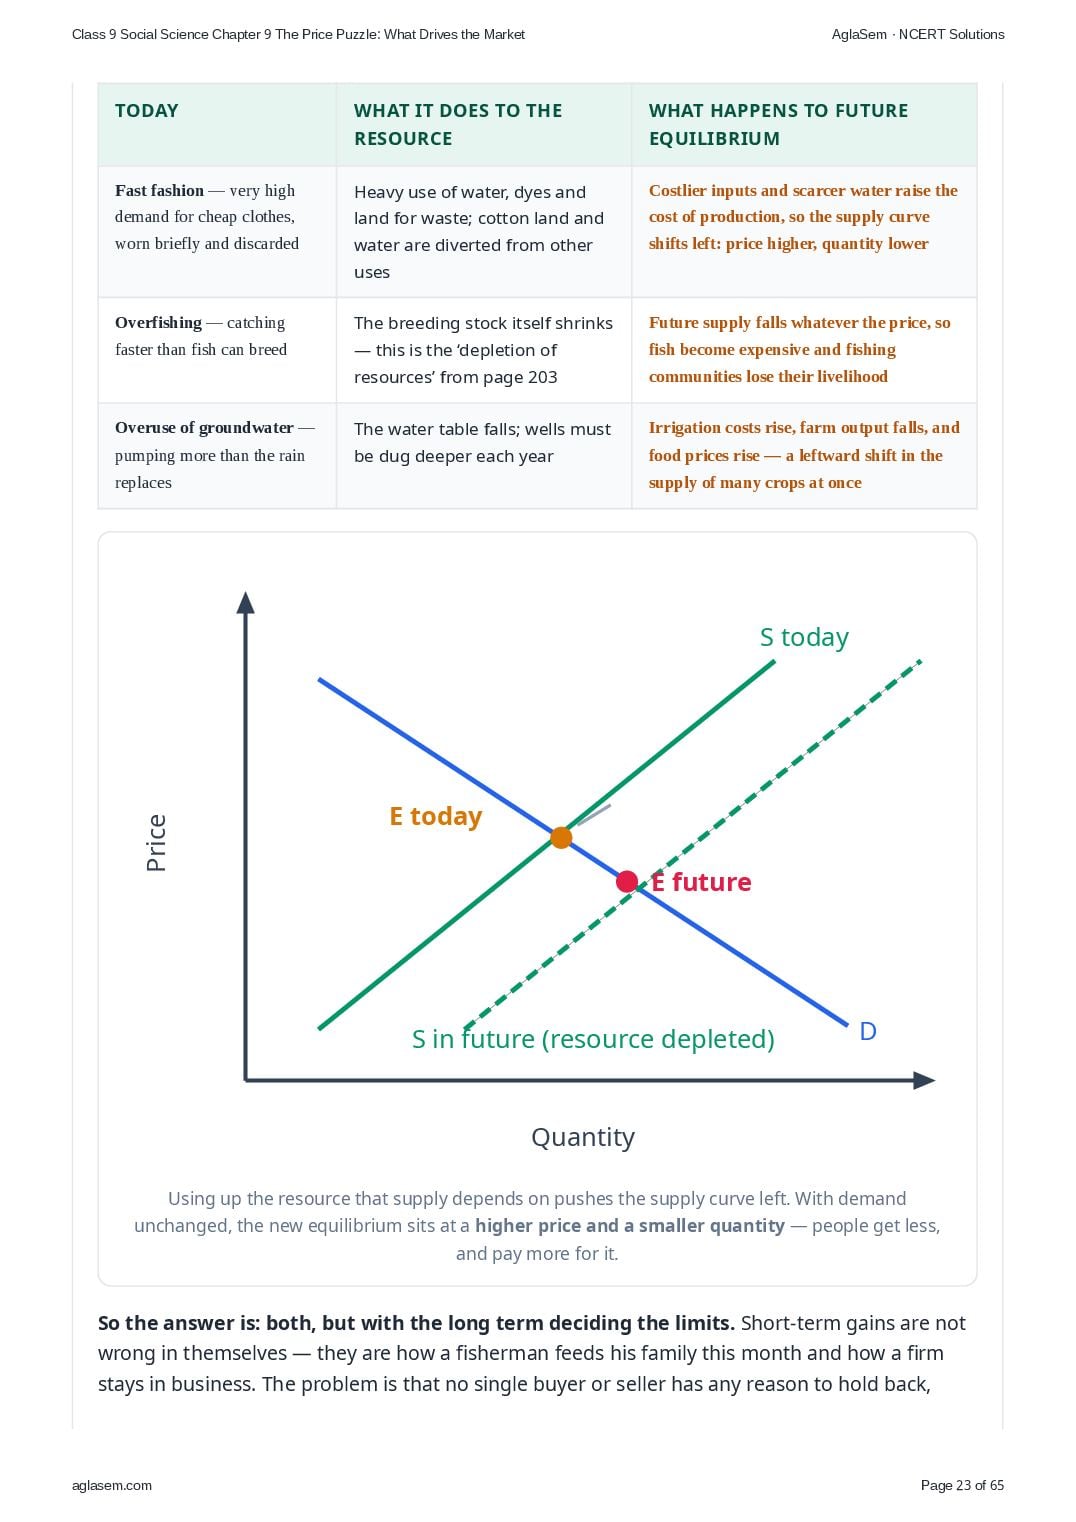
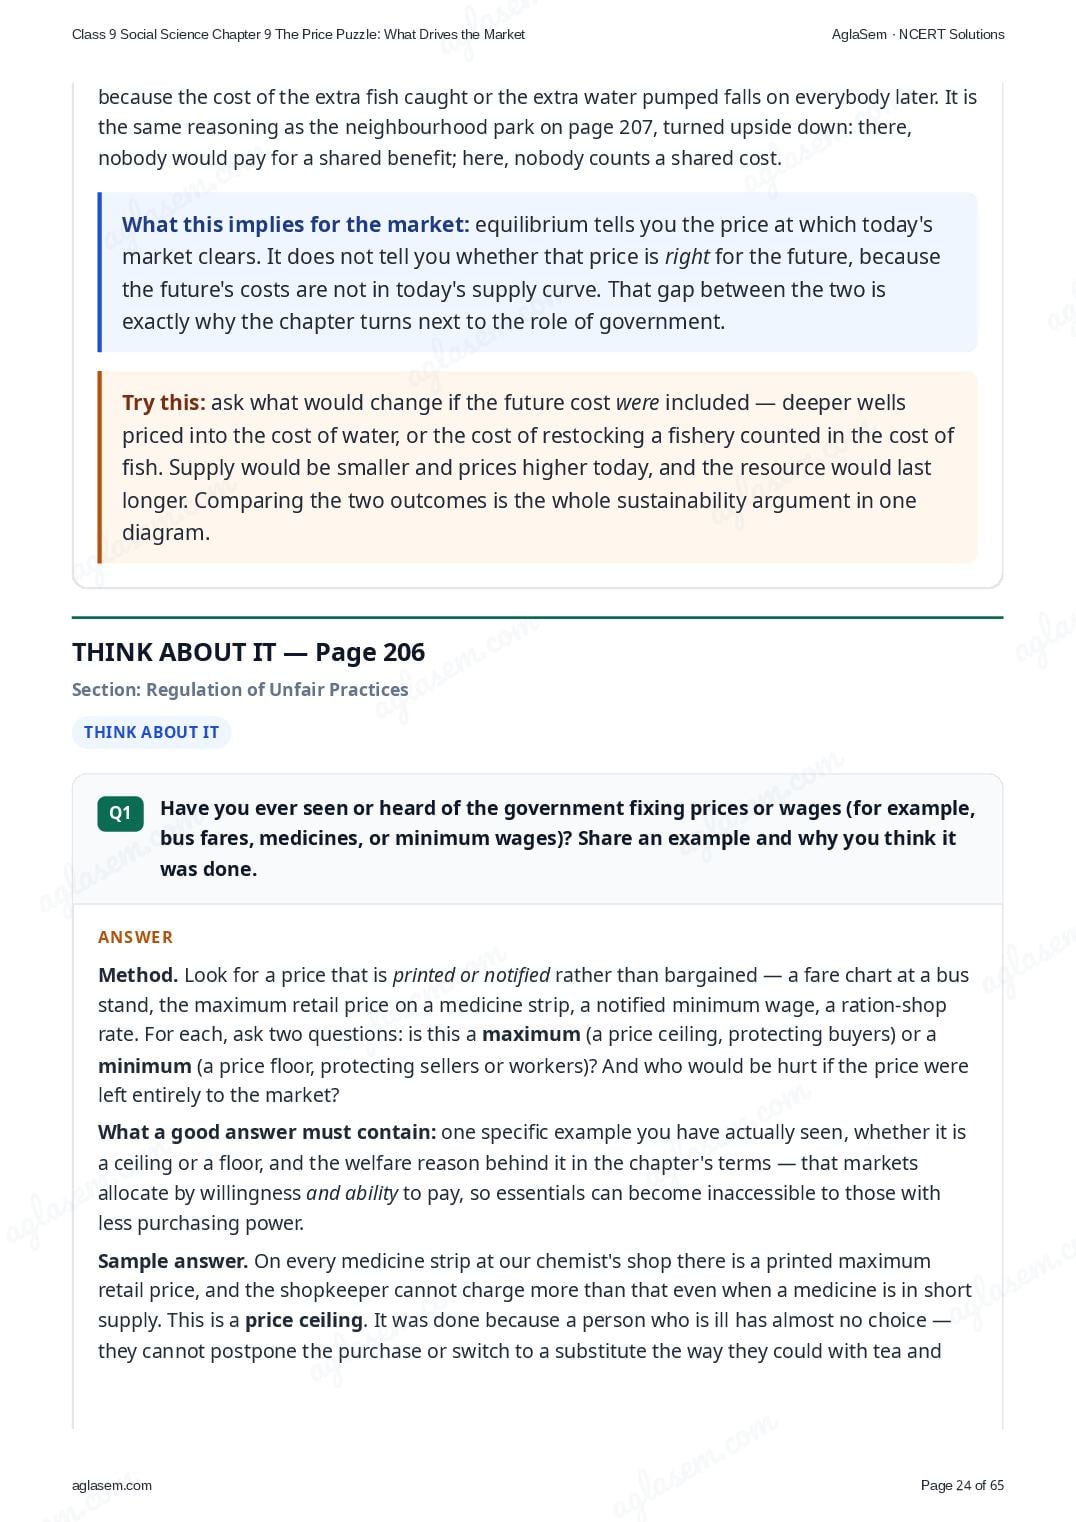
- Our choices today affect future resources. For example, high demand for fast fashion, overfishing and overuse of groundwater can harm future supply. So, should we focus only on short-term gains, or also think about long-term sustainability? How could this affect the market equilibrium?
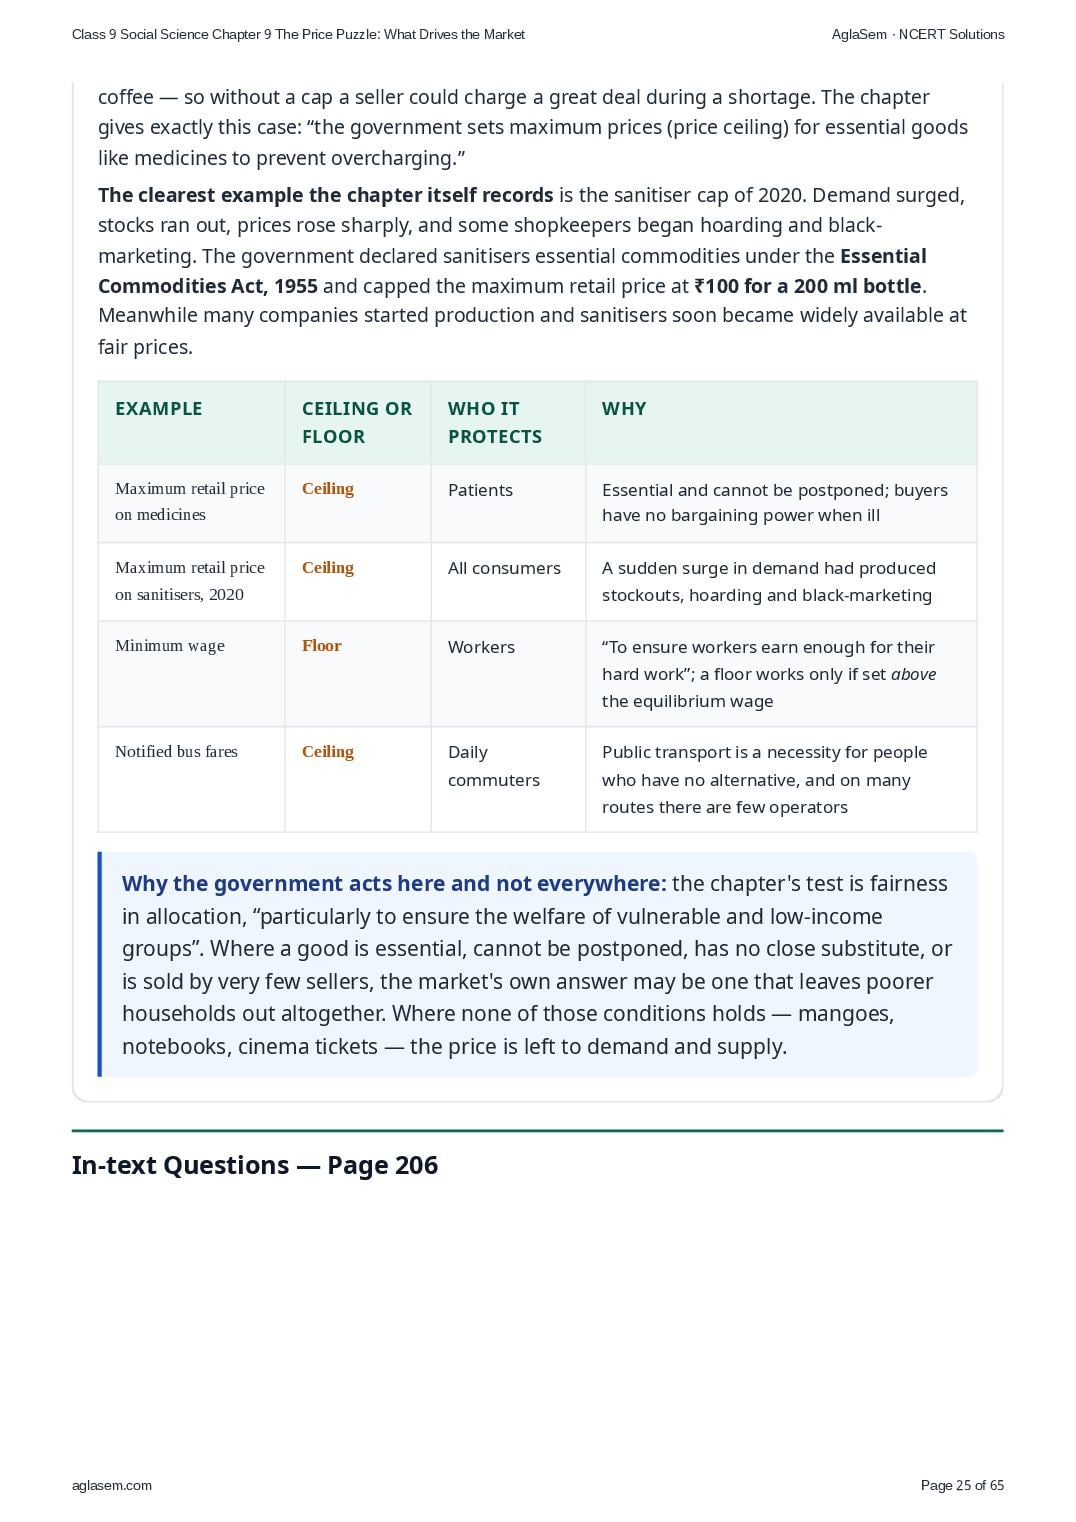
- Have you ever seen or heard of the government fixing prices or wages (for example, bus fares, medicines, or minimum wages)? Share an example and why you think it was done.
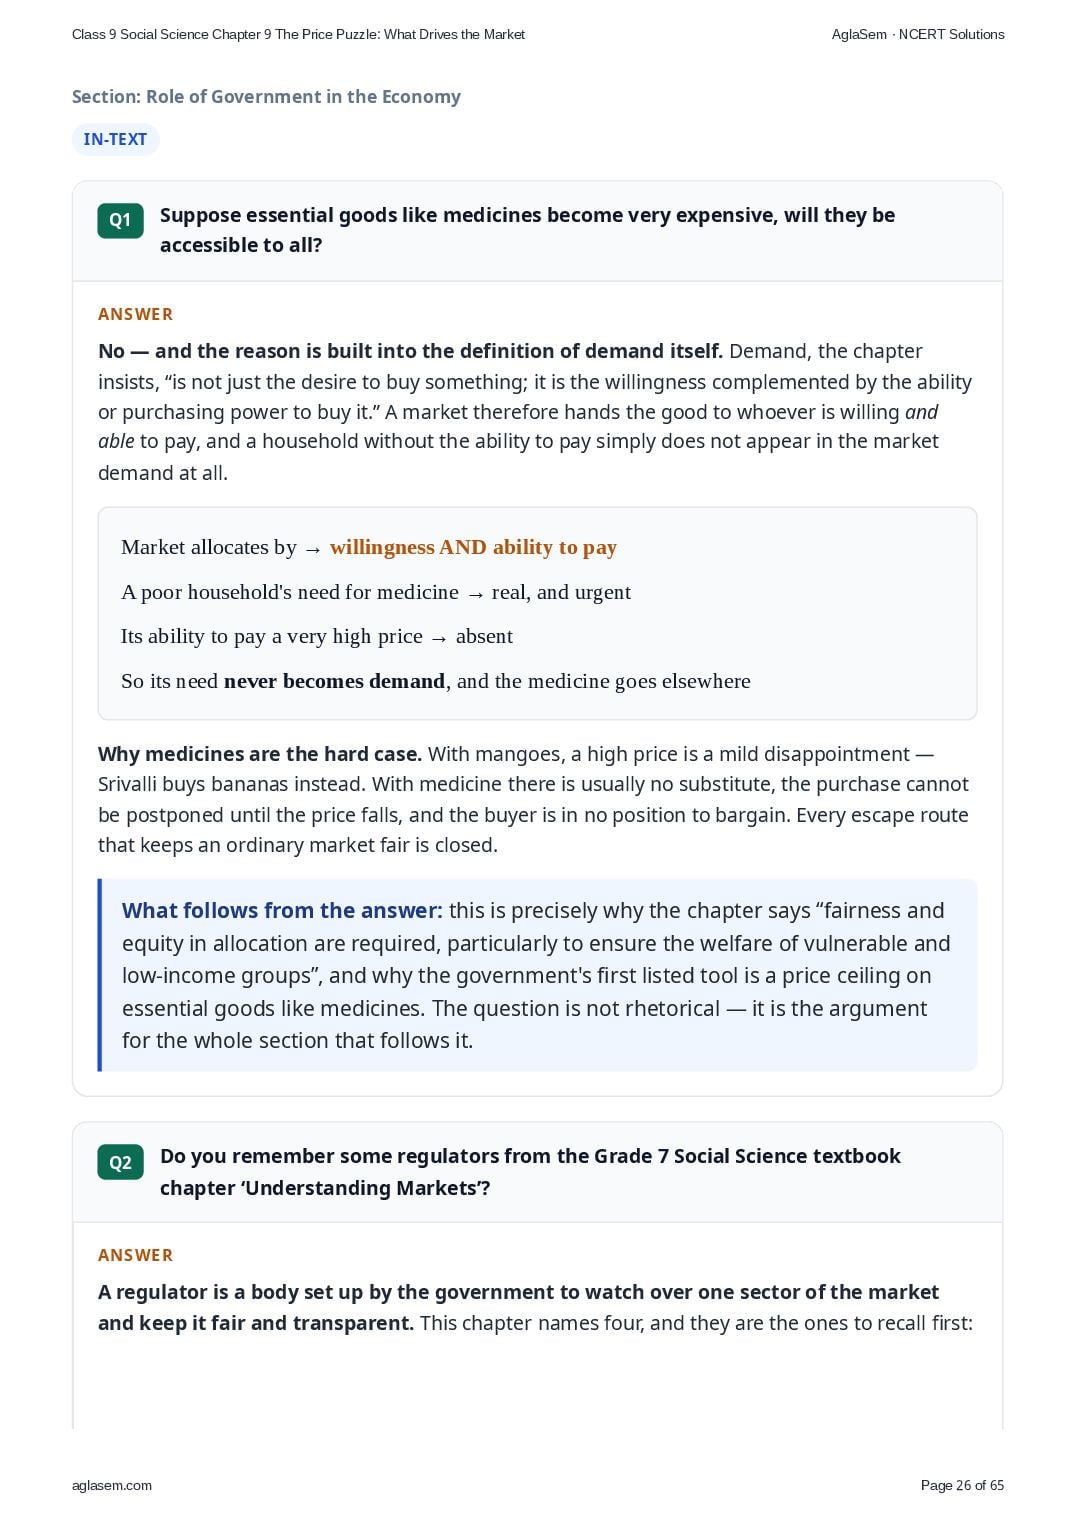
- Suppose essential goods like medicines become very expensive, will they be accessible to all?
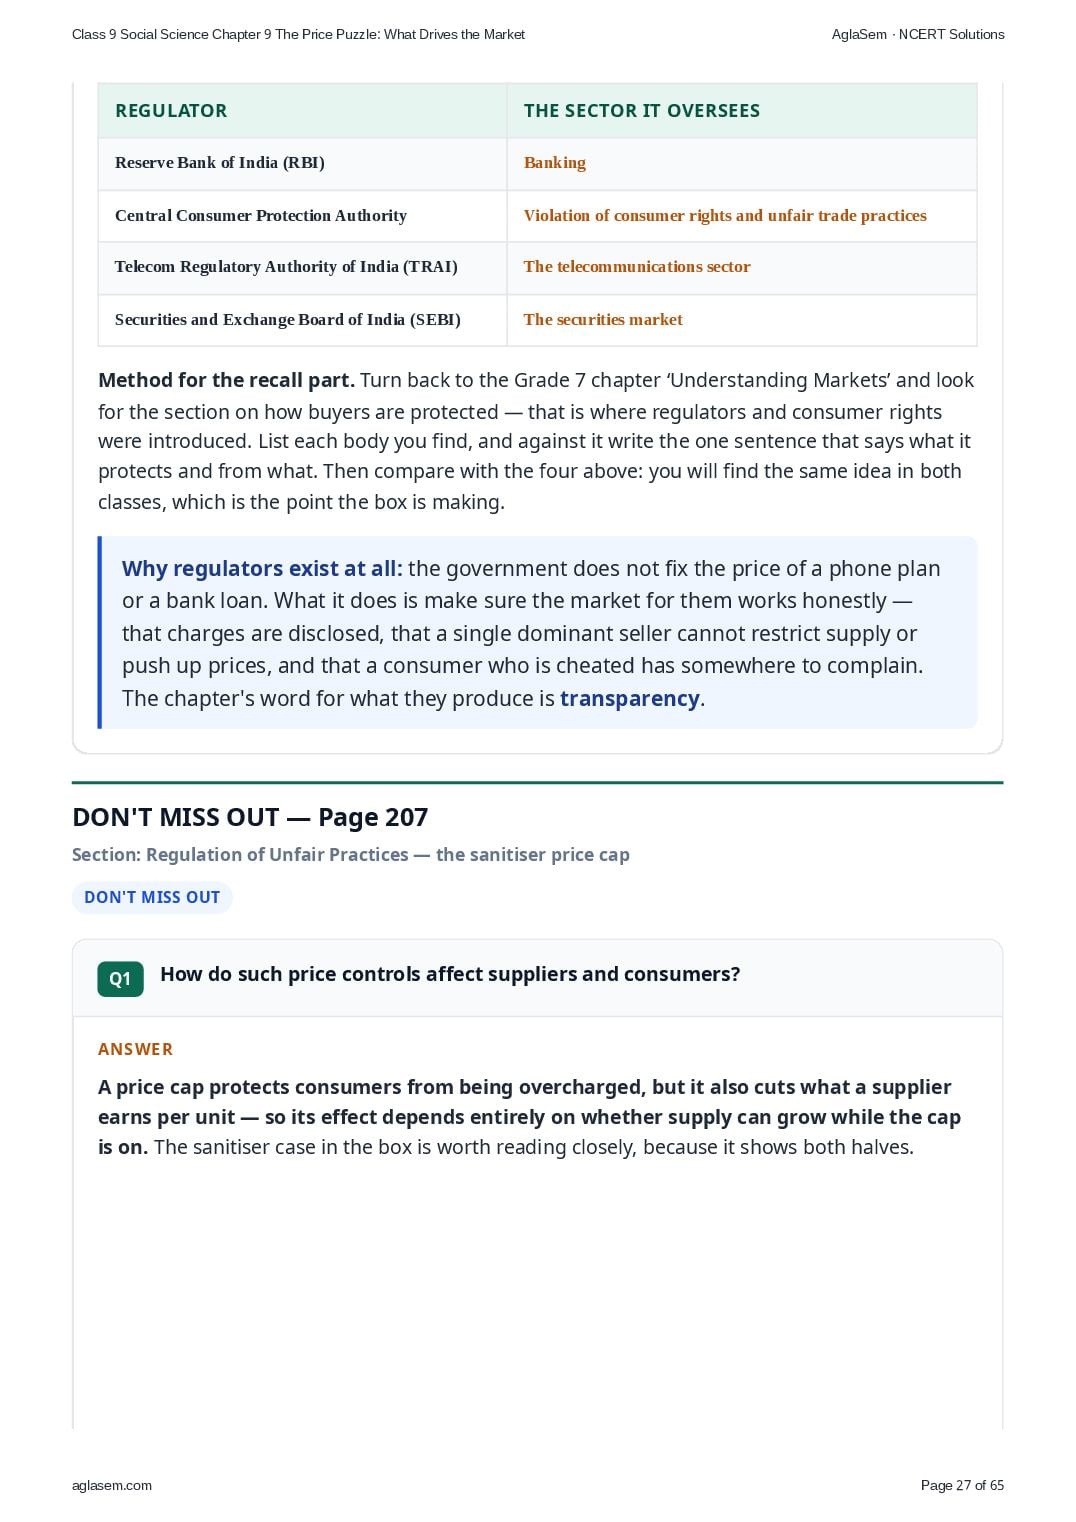
- Do you remember some regulators from the Grade 7 Social Science textbook chapter ‘Understanding Markets’?
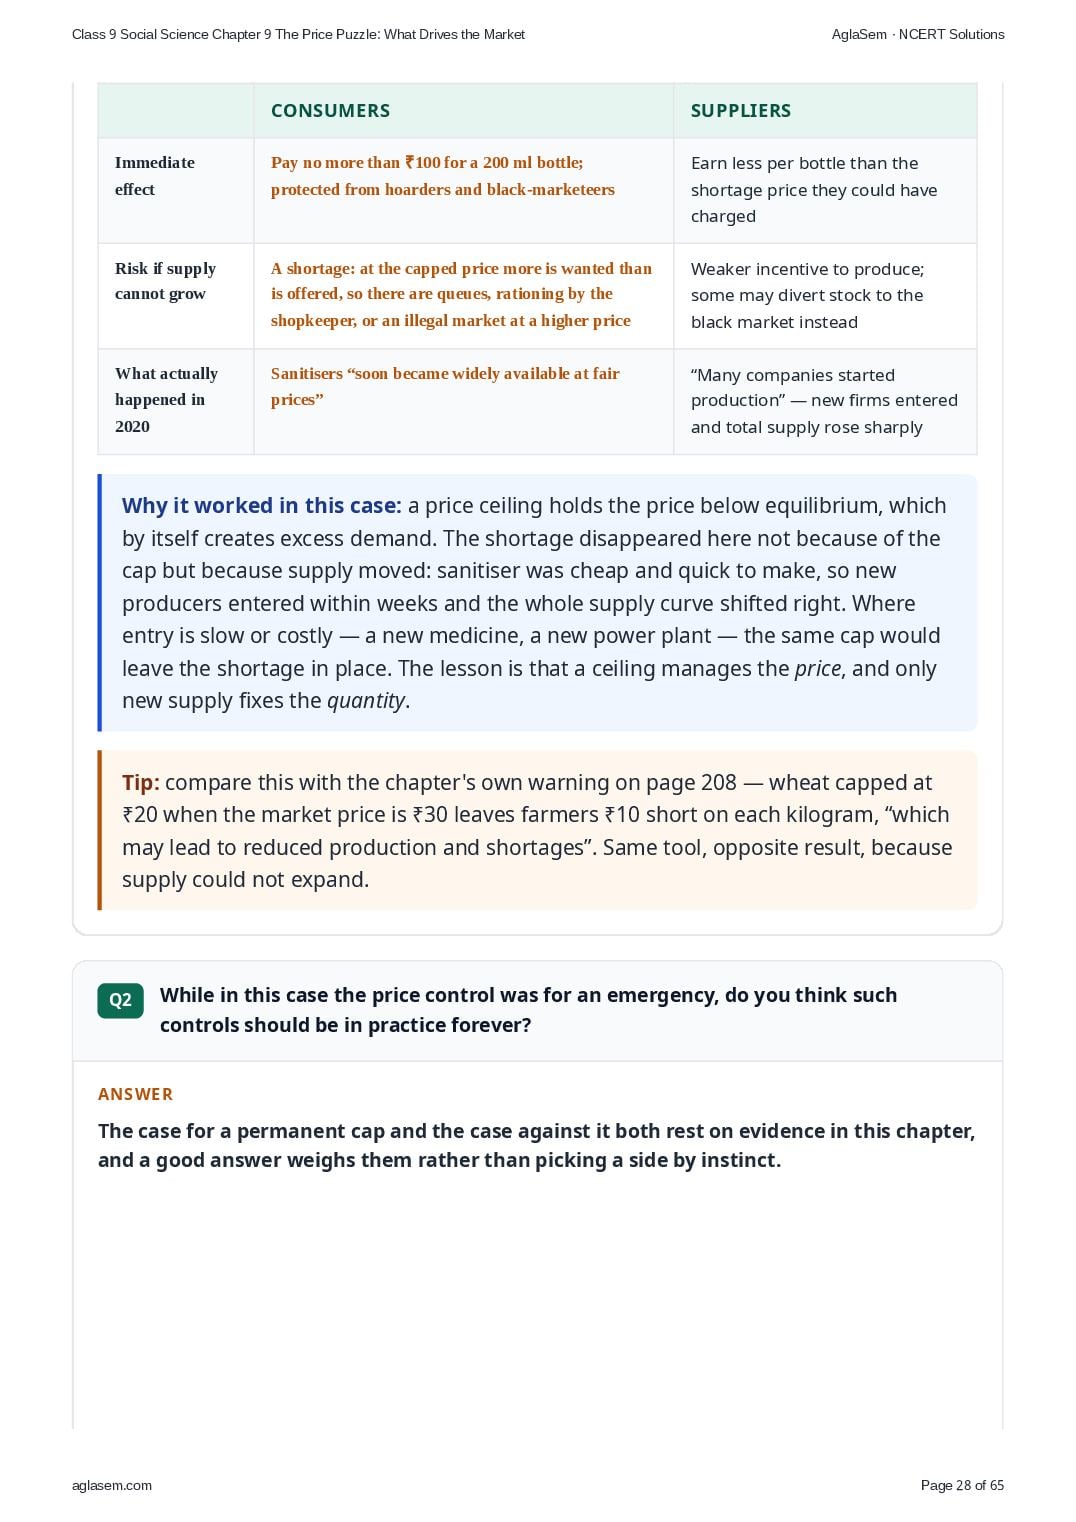
- How do such price controls affect suppliers and consumers?
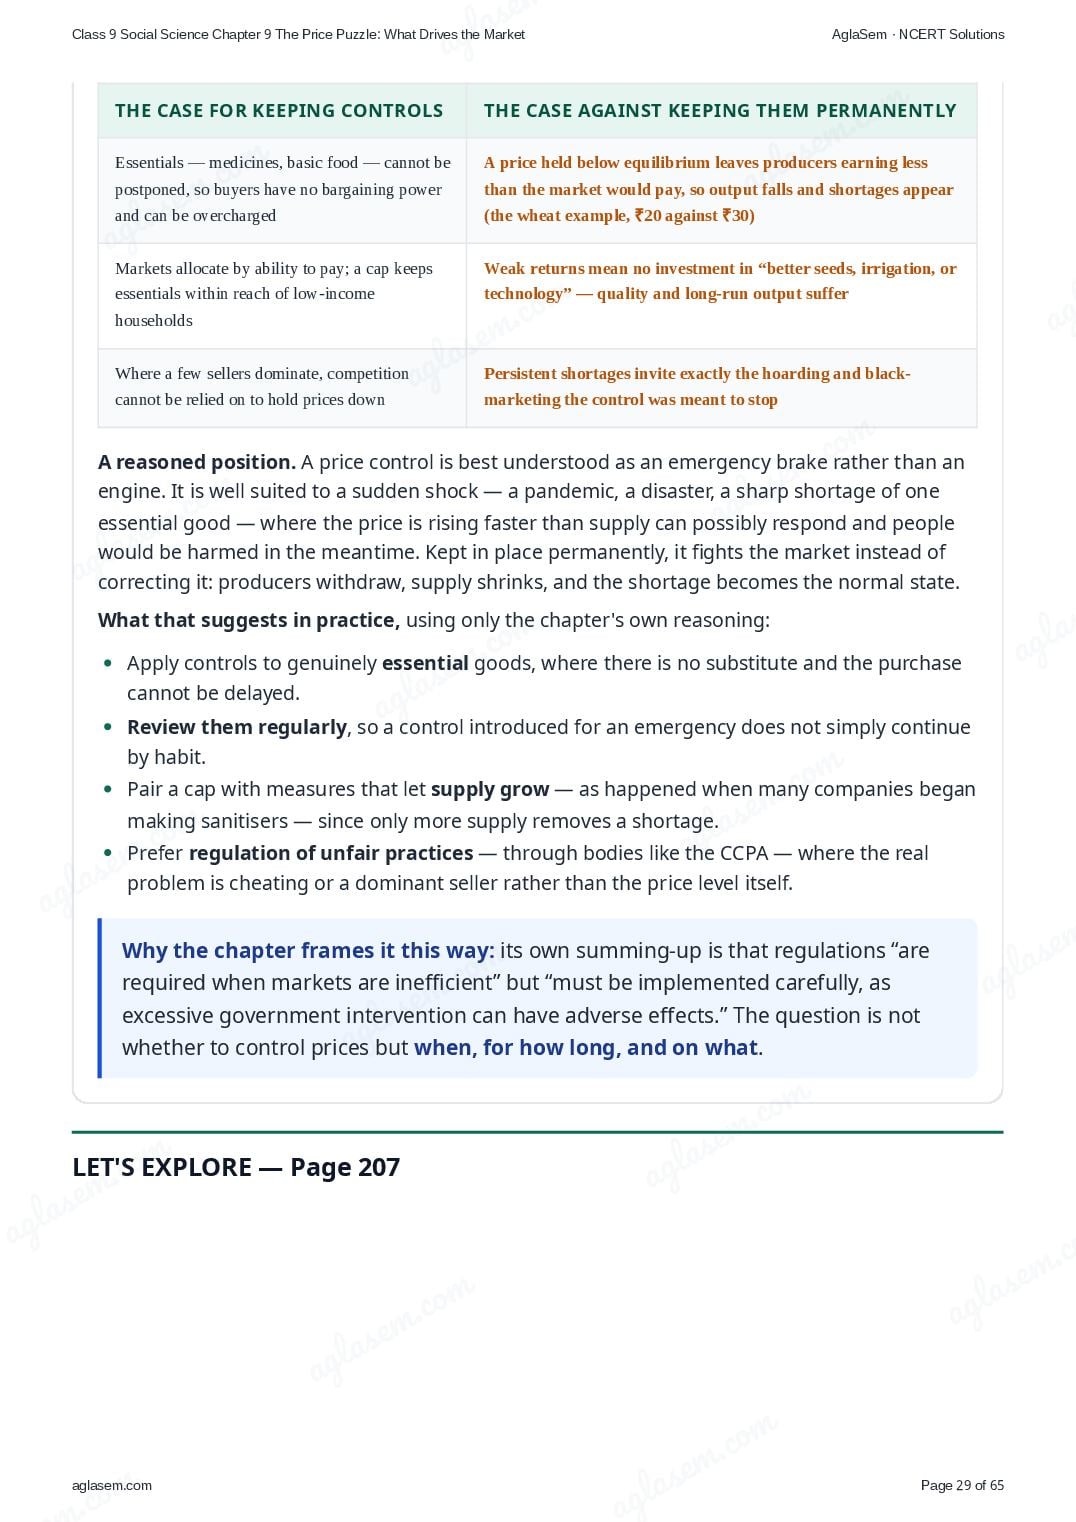
- While in this case the price control was for an emergency, do you think such controls should be in practice forever?
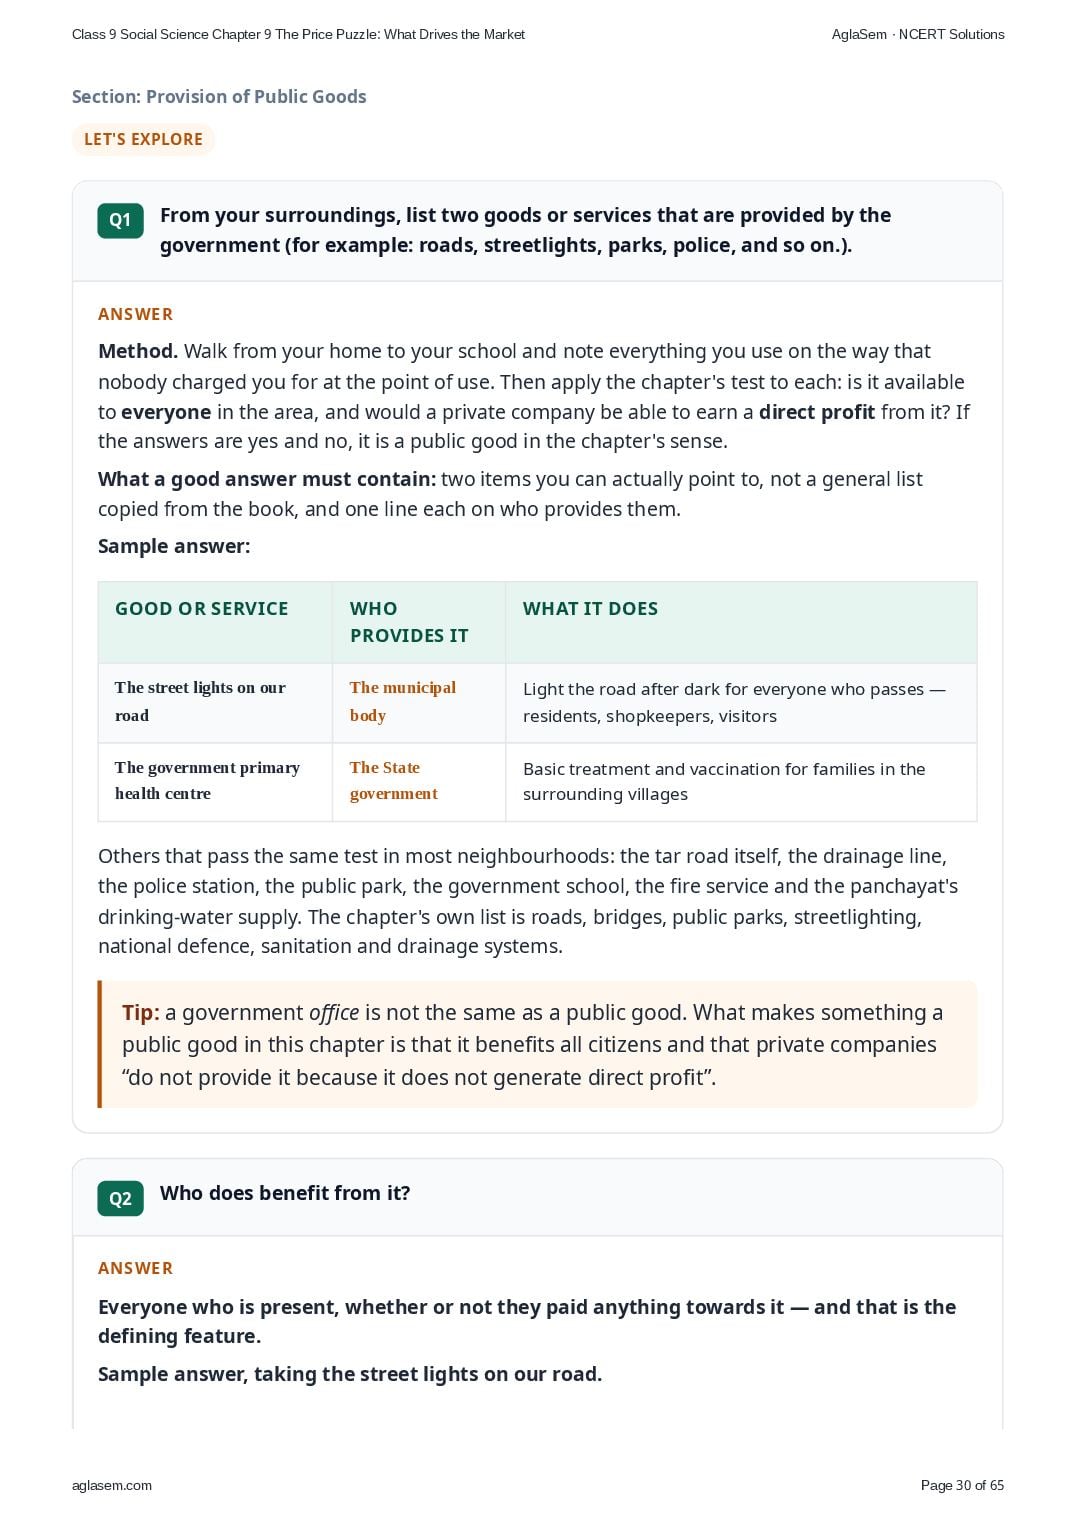
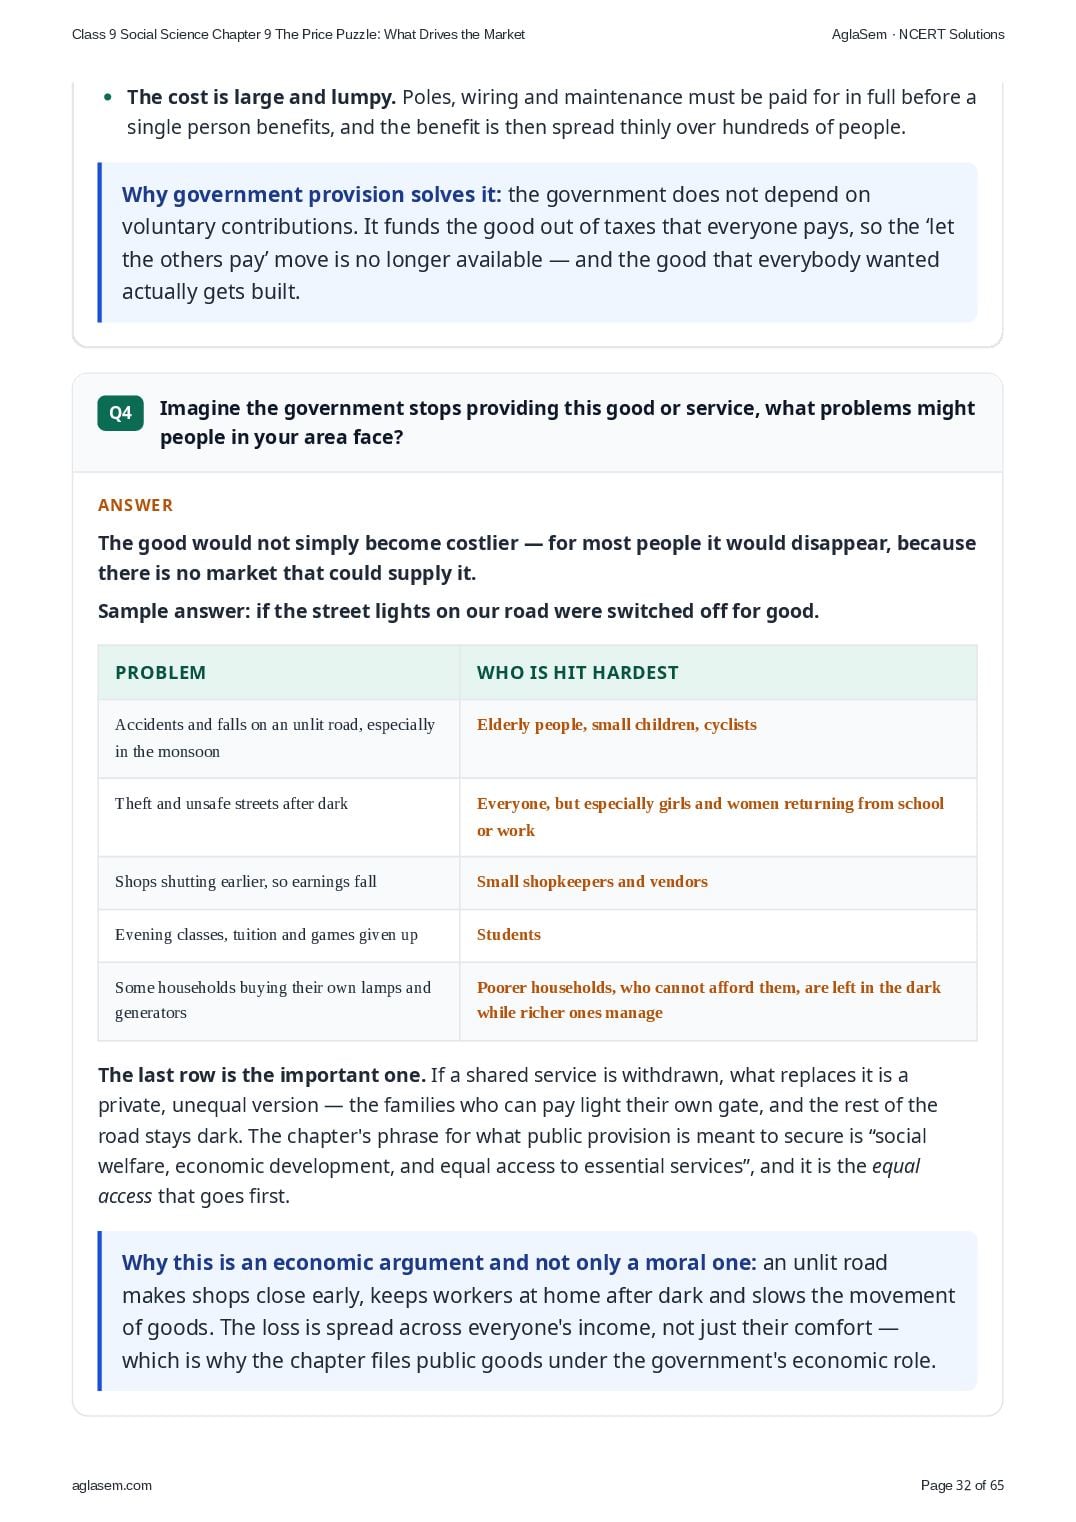
- From your surroundings, list two goods or services that are provided by the government (for example: roads, streetlights, parks, police, and so on.).
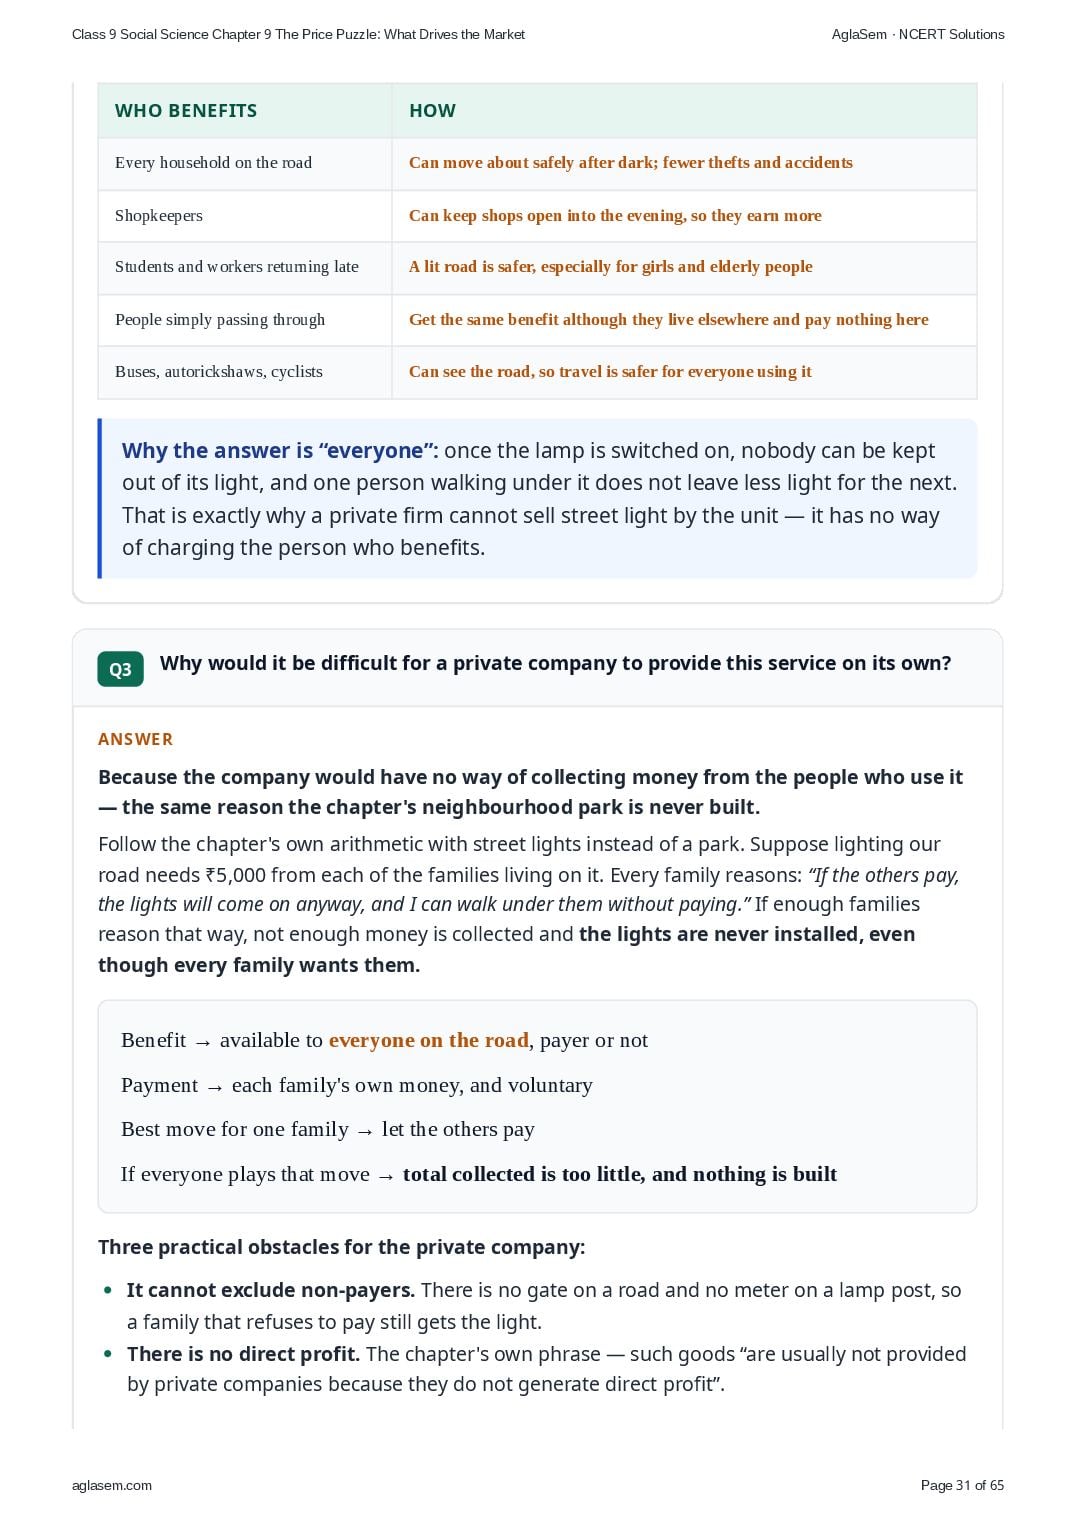
- Who does benefit from it?
- Why would it be difficult for a private company to provide this service on its own?
- Imagine the government stops providing this good or service, what problems might people in your area face?
- According to you, how should a democratic government decide when and how much it should intervene in markets to protect people's welfare?
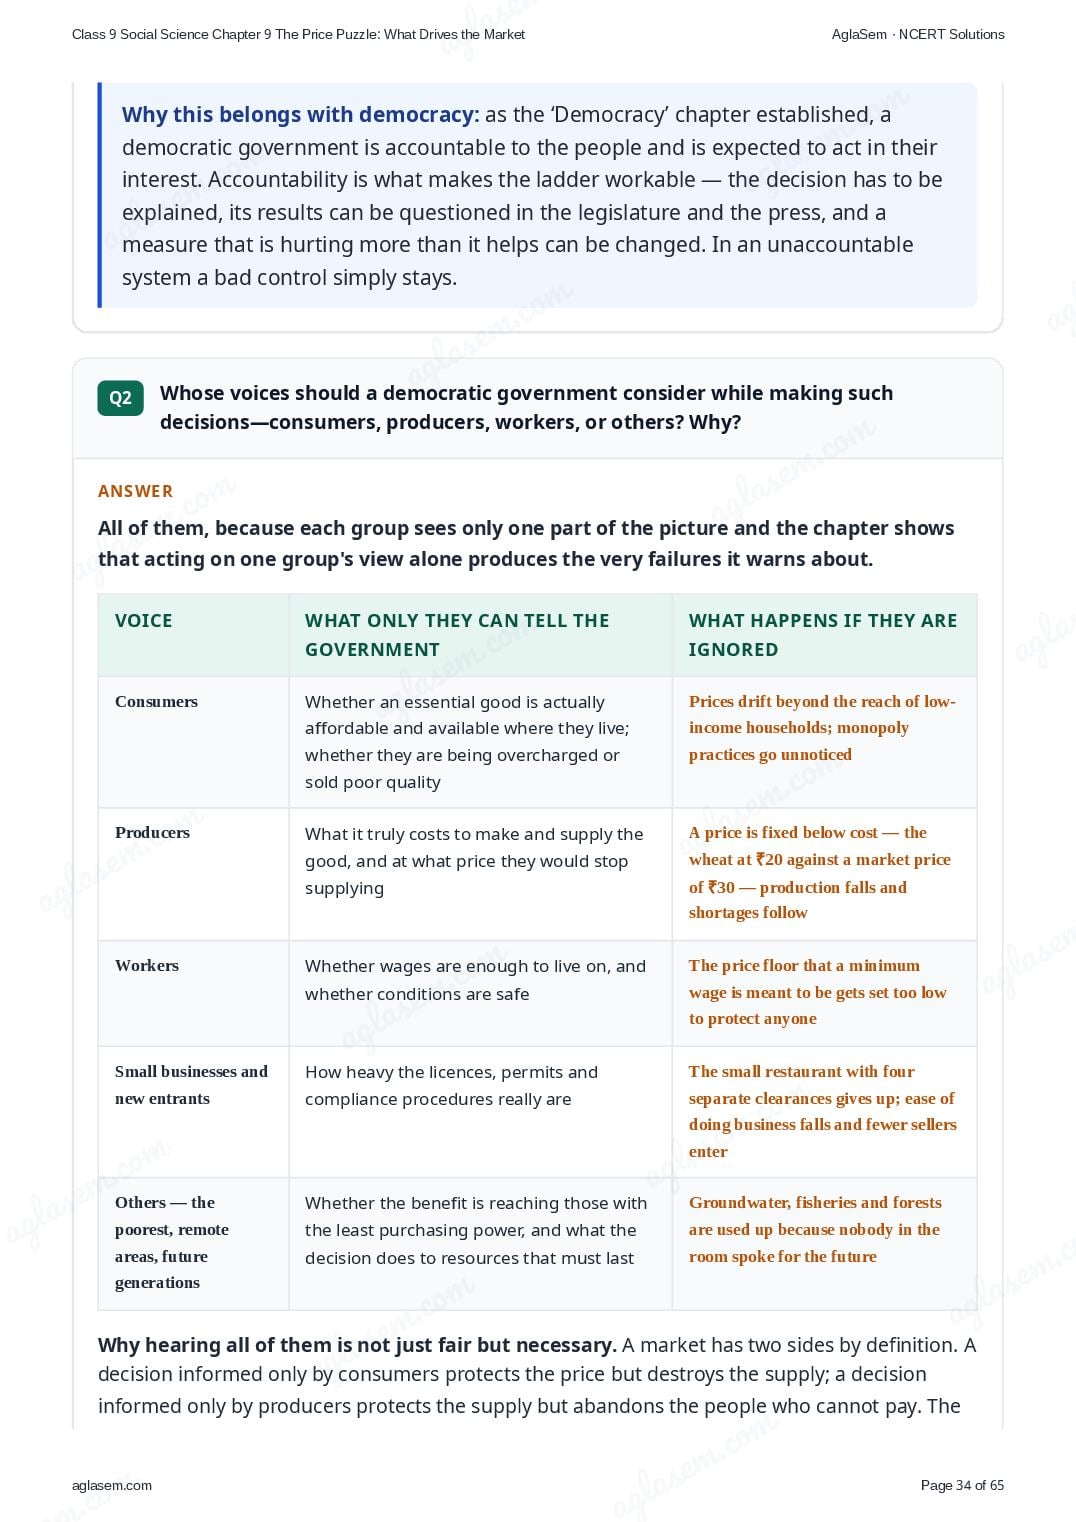
- Whose voices should a democratic government consider while making such decisions—consumers, producers, workers, or others? Why?
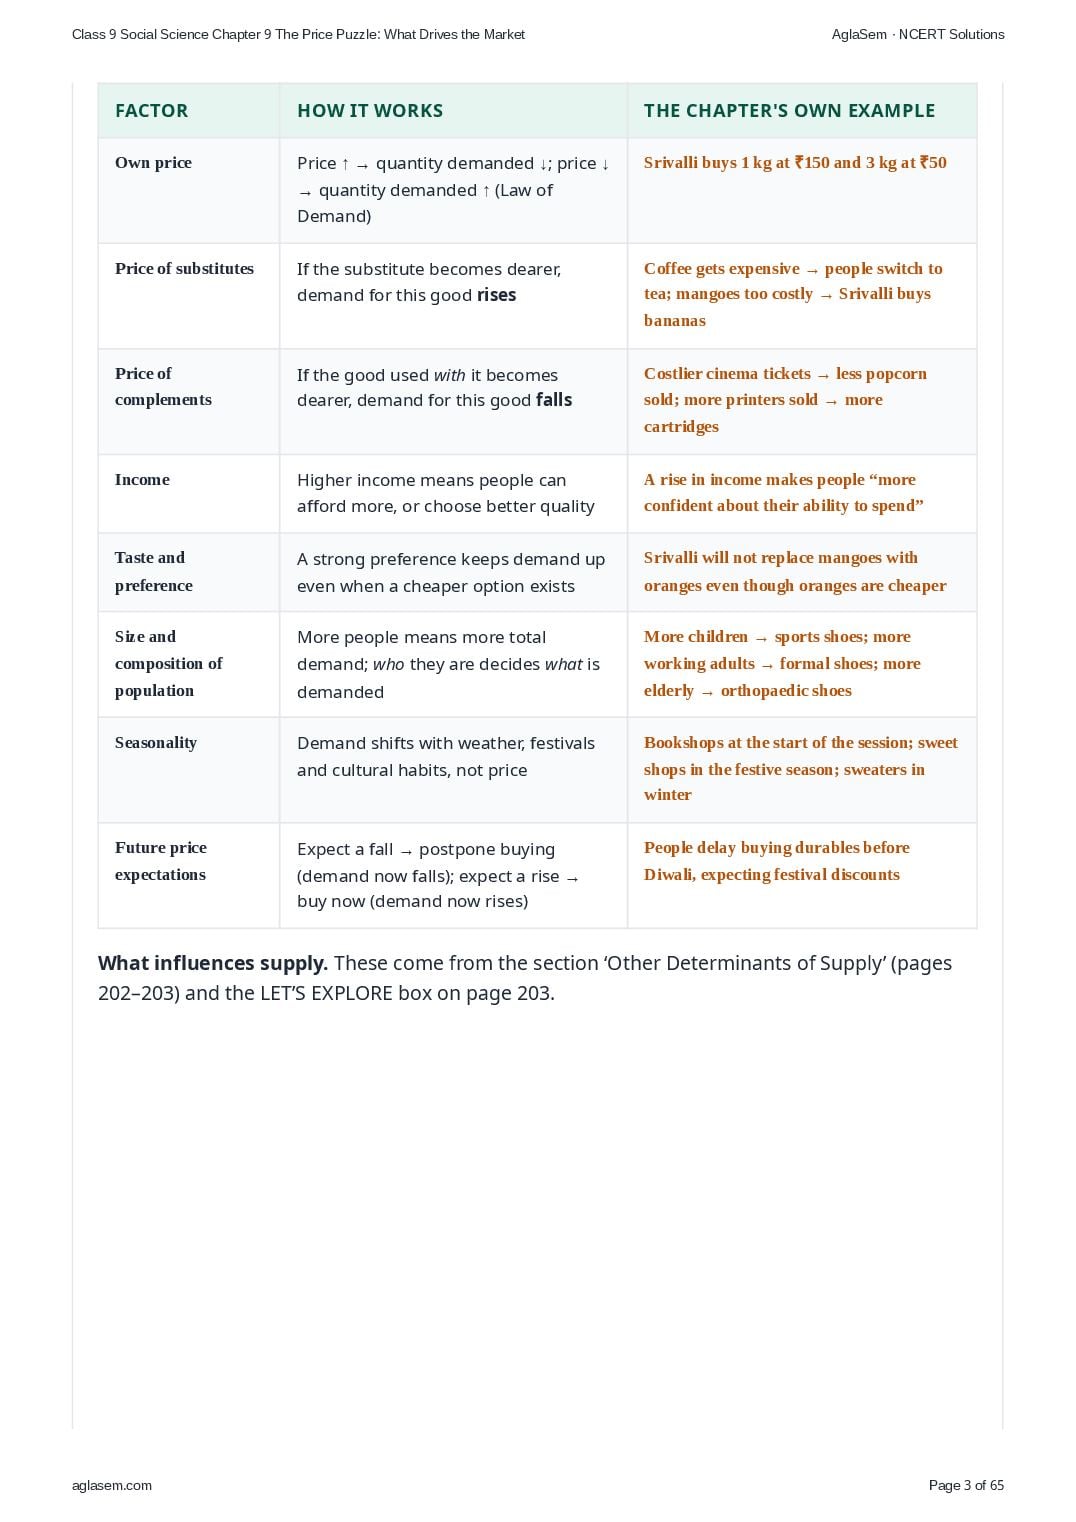
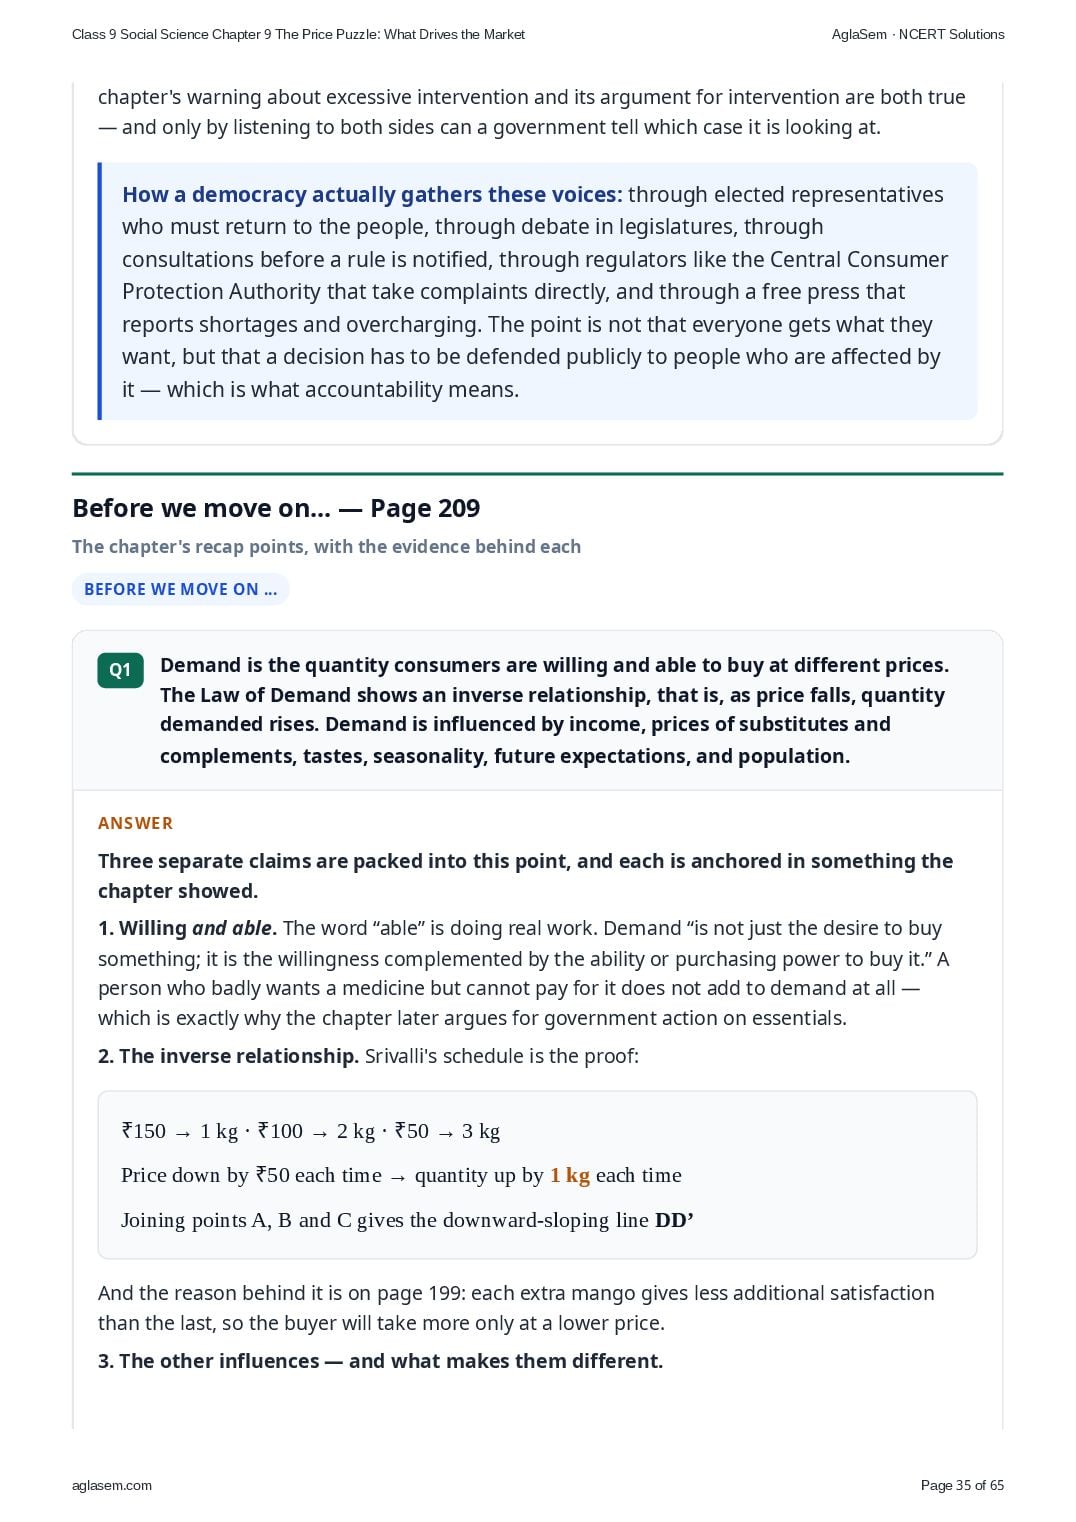
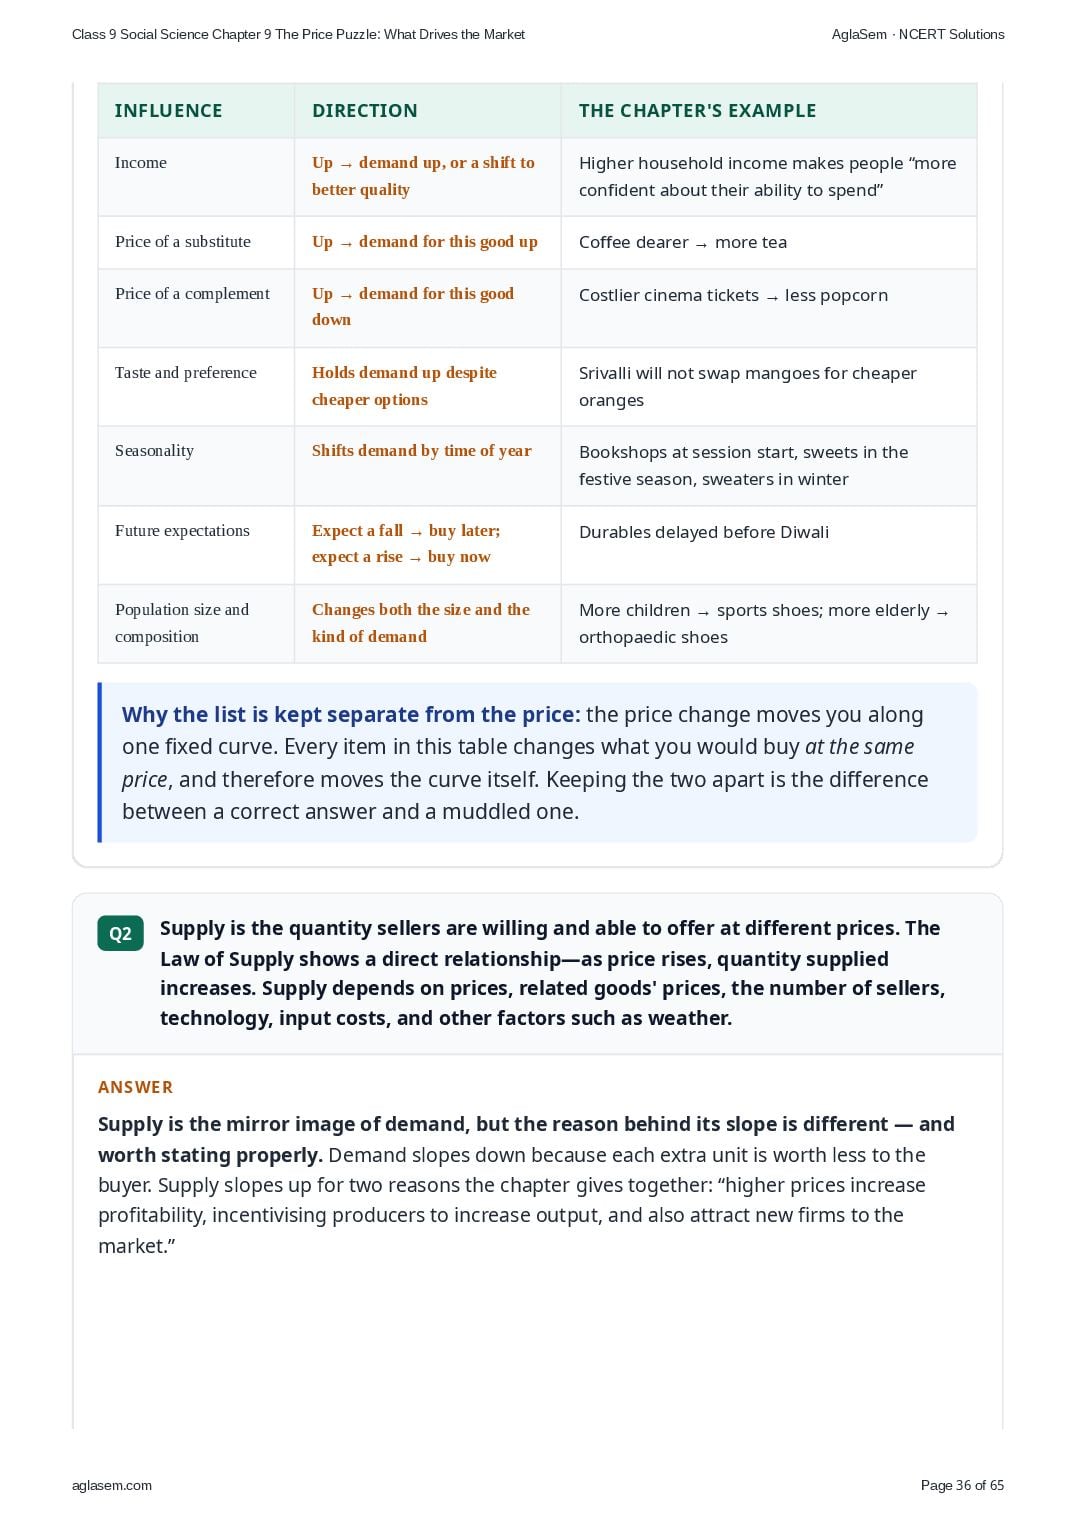
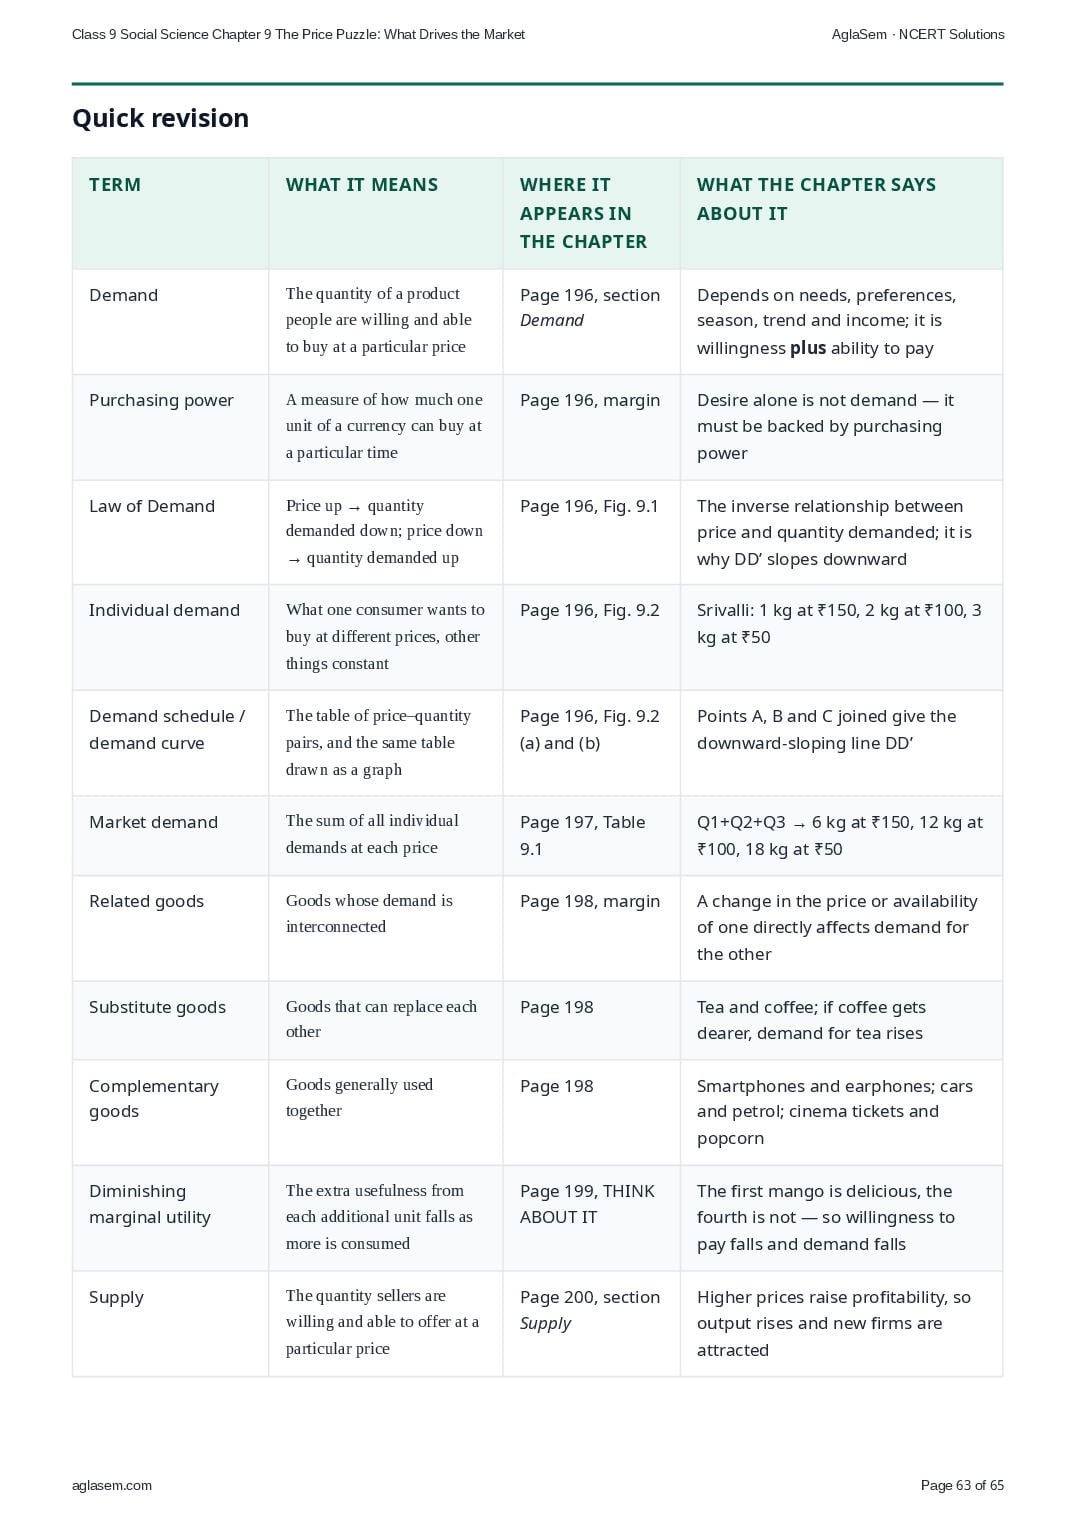
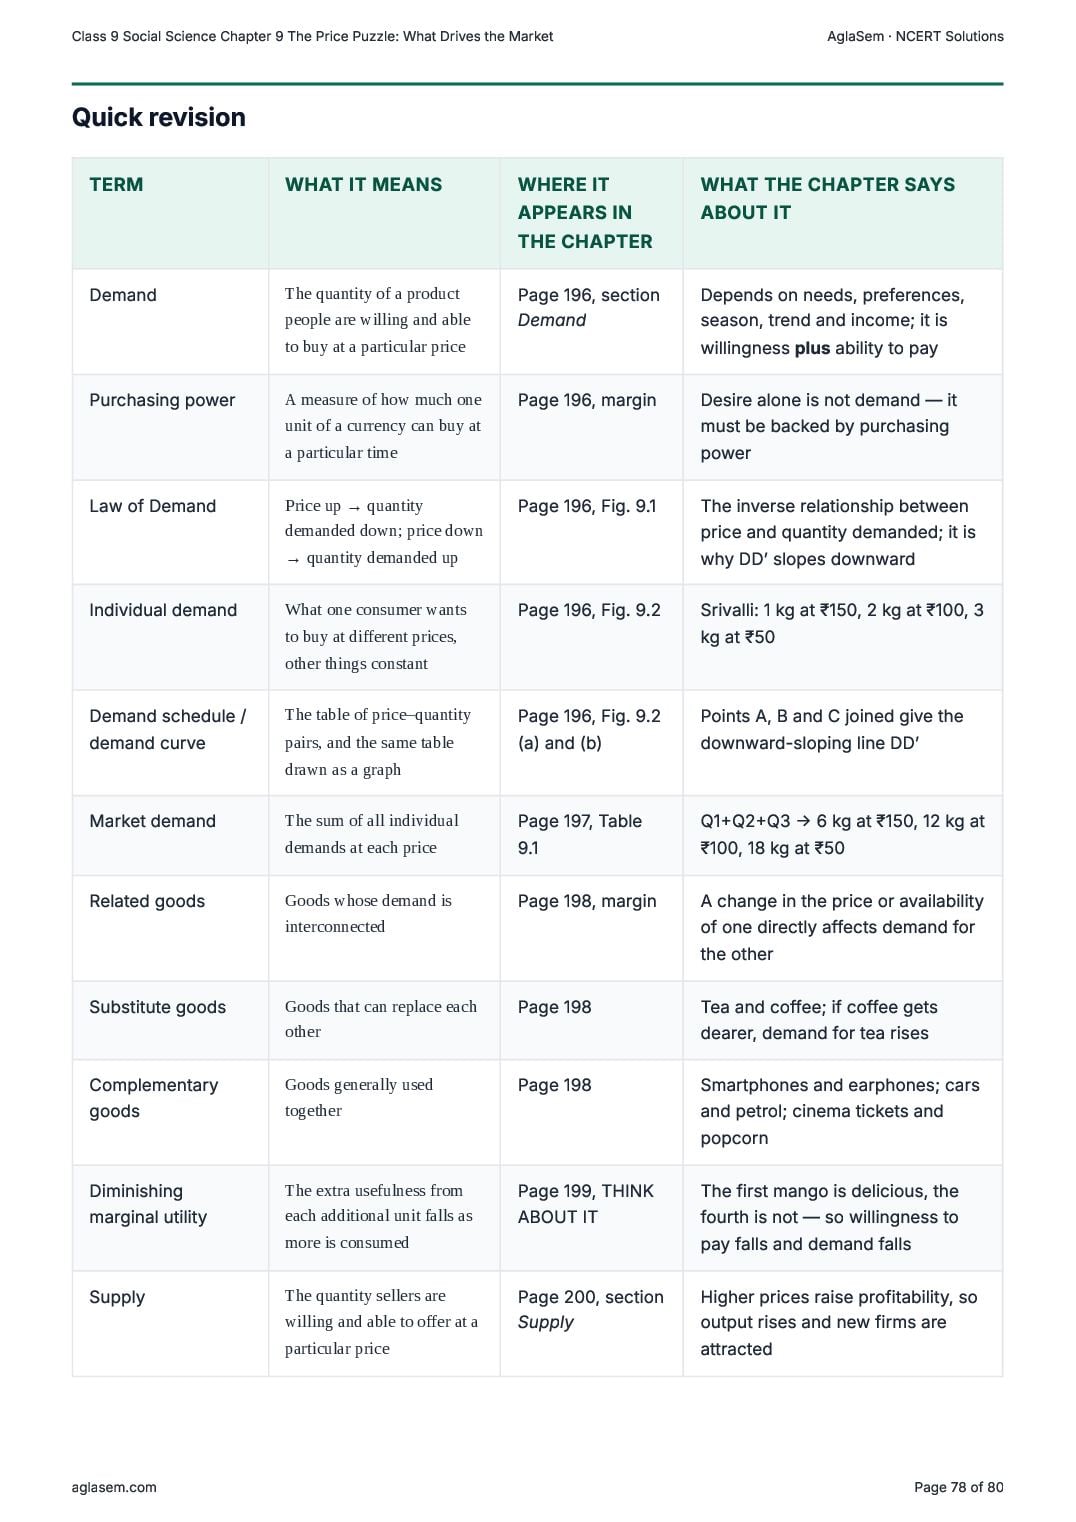
- Demand is the quantity consumers are willing and able to buy at different prices. The Law of Demand shows an inverse relationship, that is, as price falls, quantity demanded rises. Demand is influenced by income, prices of substitutes and complements, tastes, seasonality, future expectations, and population.
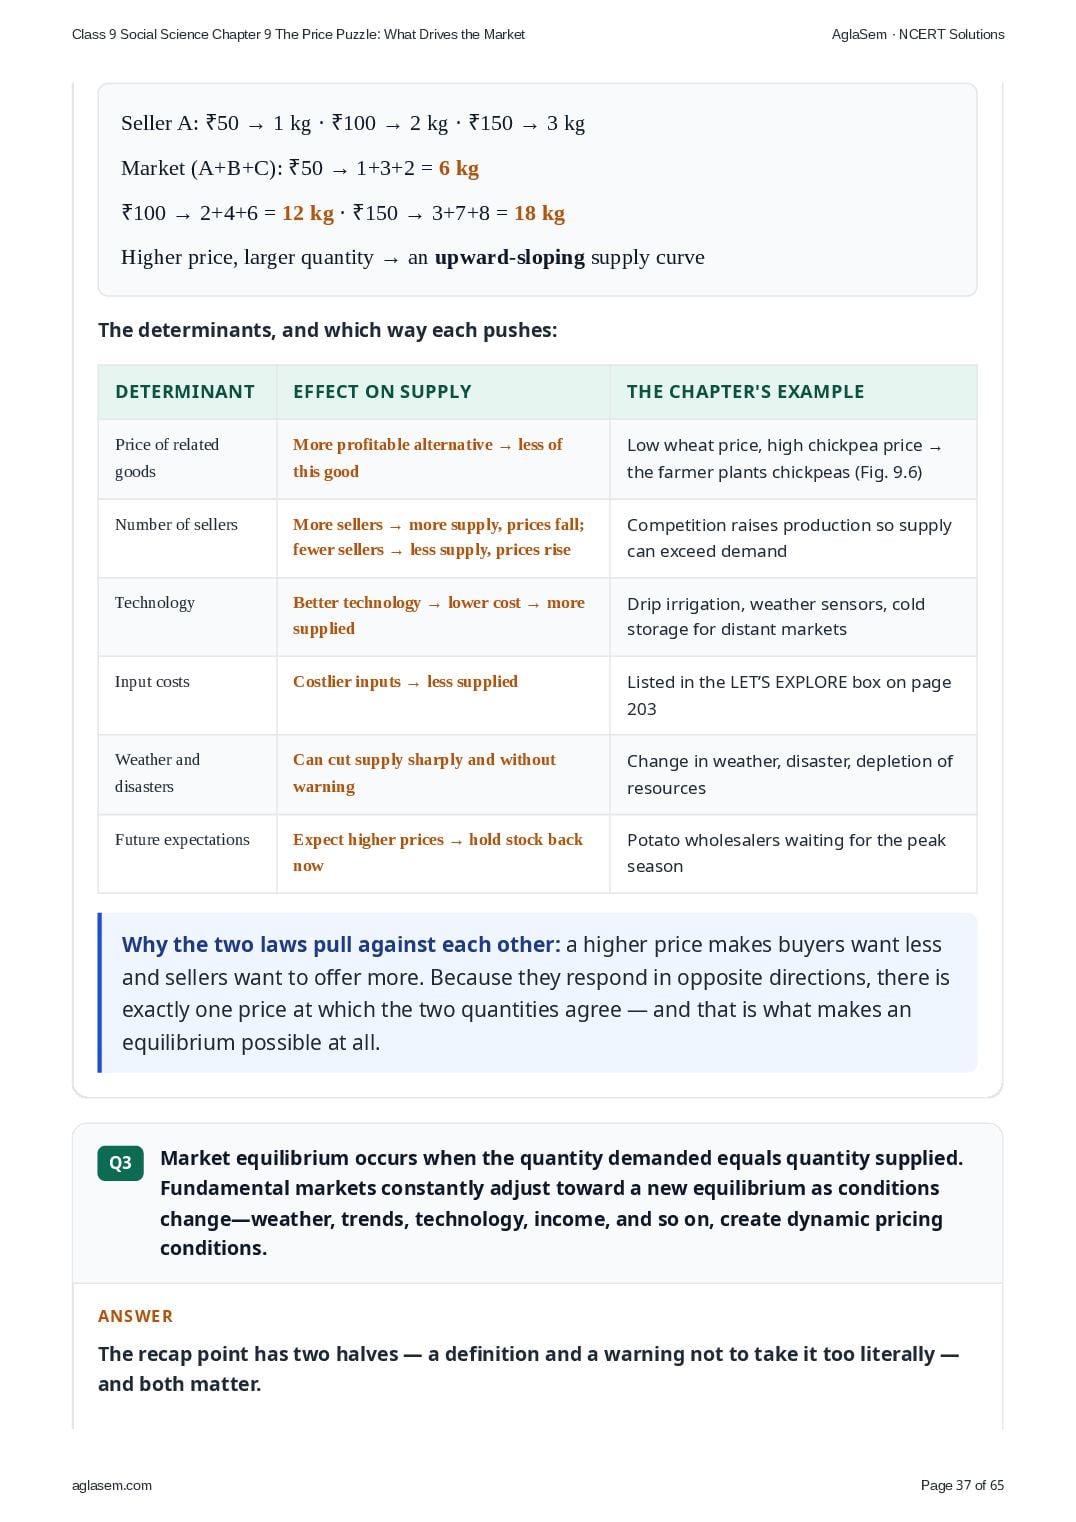
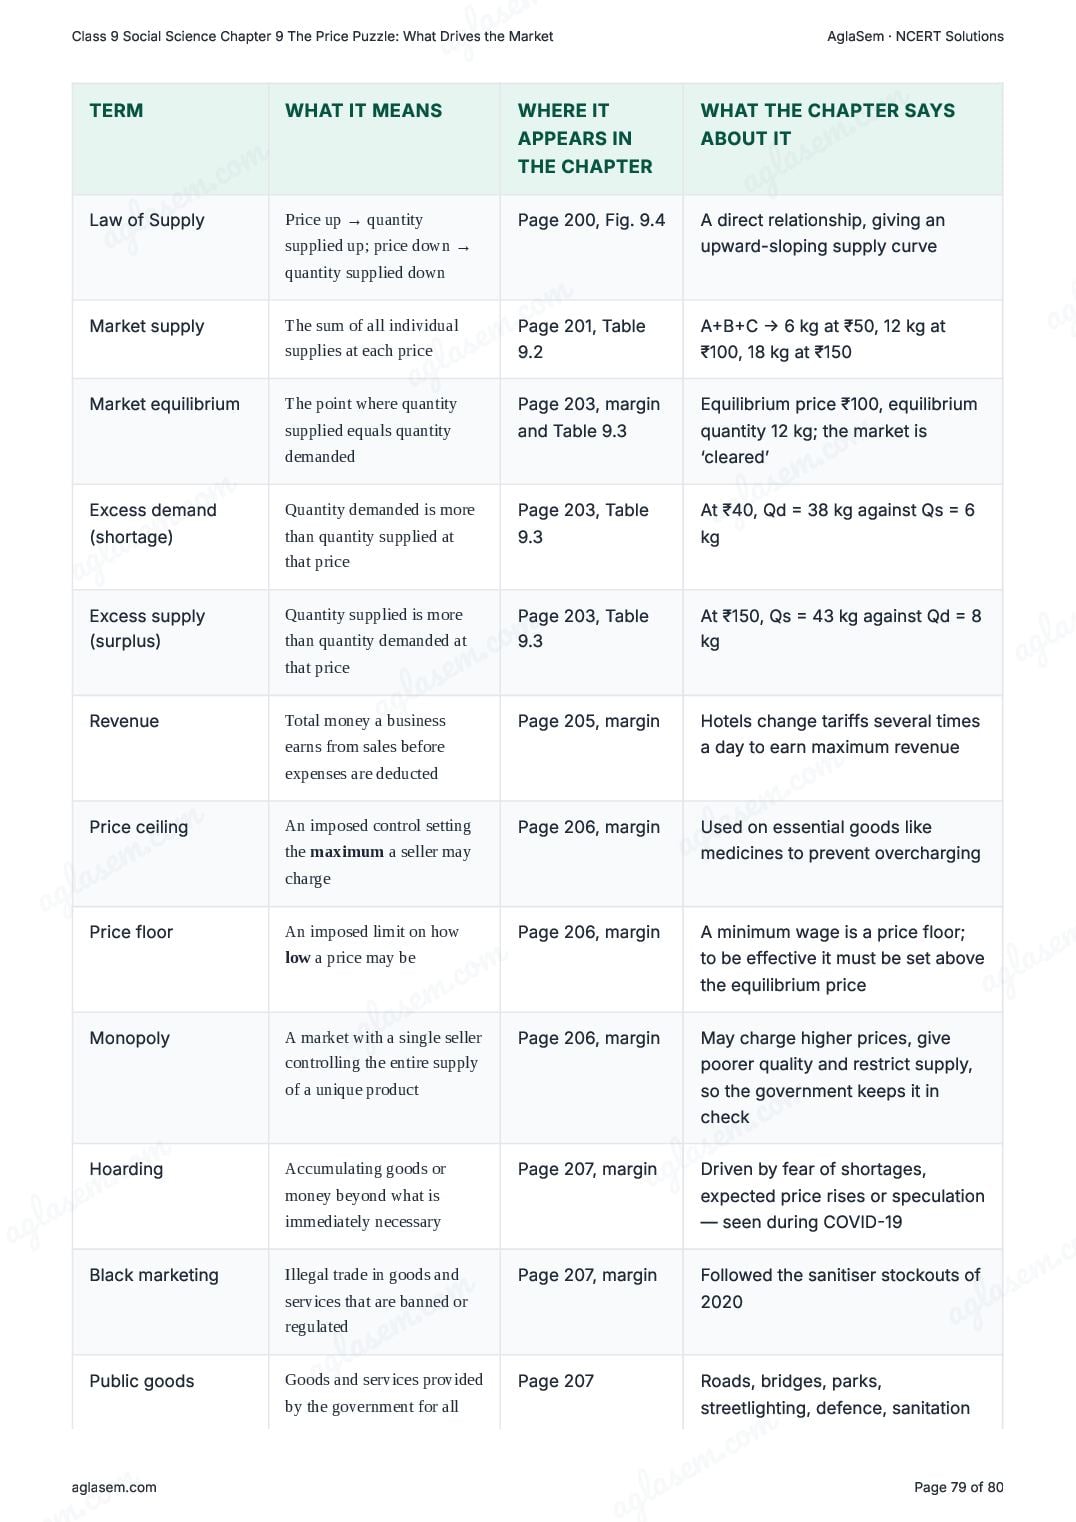
- Supply is the quantity sellers are willing and able to offer at different prices. The Law of Supply shows a direct relationship—as price rises, quantity supplied increases. Supply depends on prices, related goods' prices, the number of sellers, technology, input costs, and other factors such as weather.
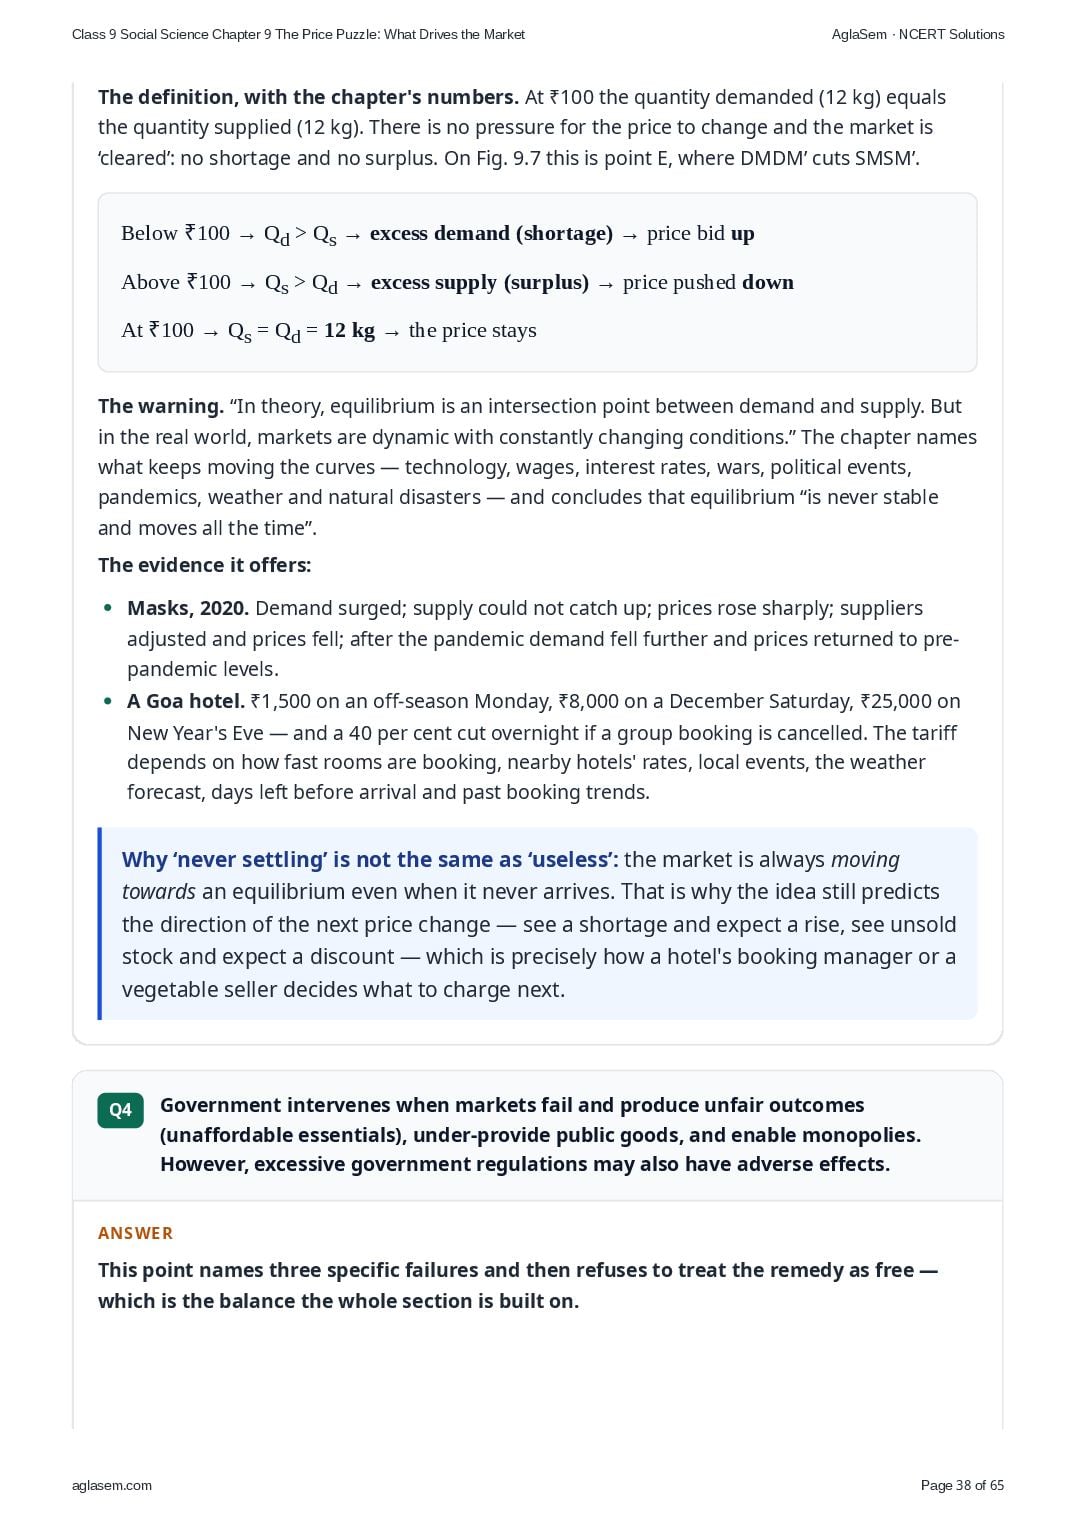
- Market equilibrium occurs when the quantity demanded equals quantity supplied. Fundamental markets constantly adjust toward a new equilibrium as conditions change—weather, trends, technology, income, and so on, create dynamic pricing conditions.
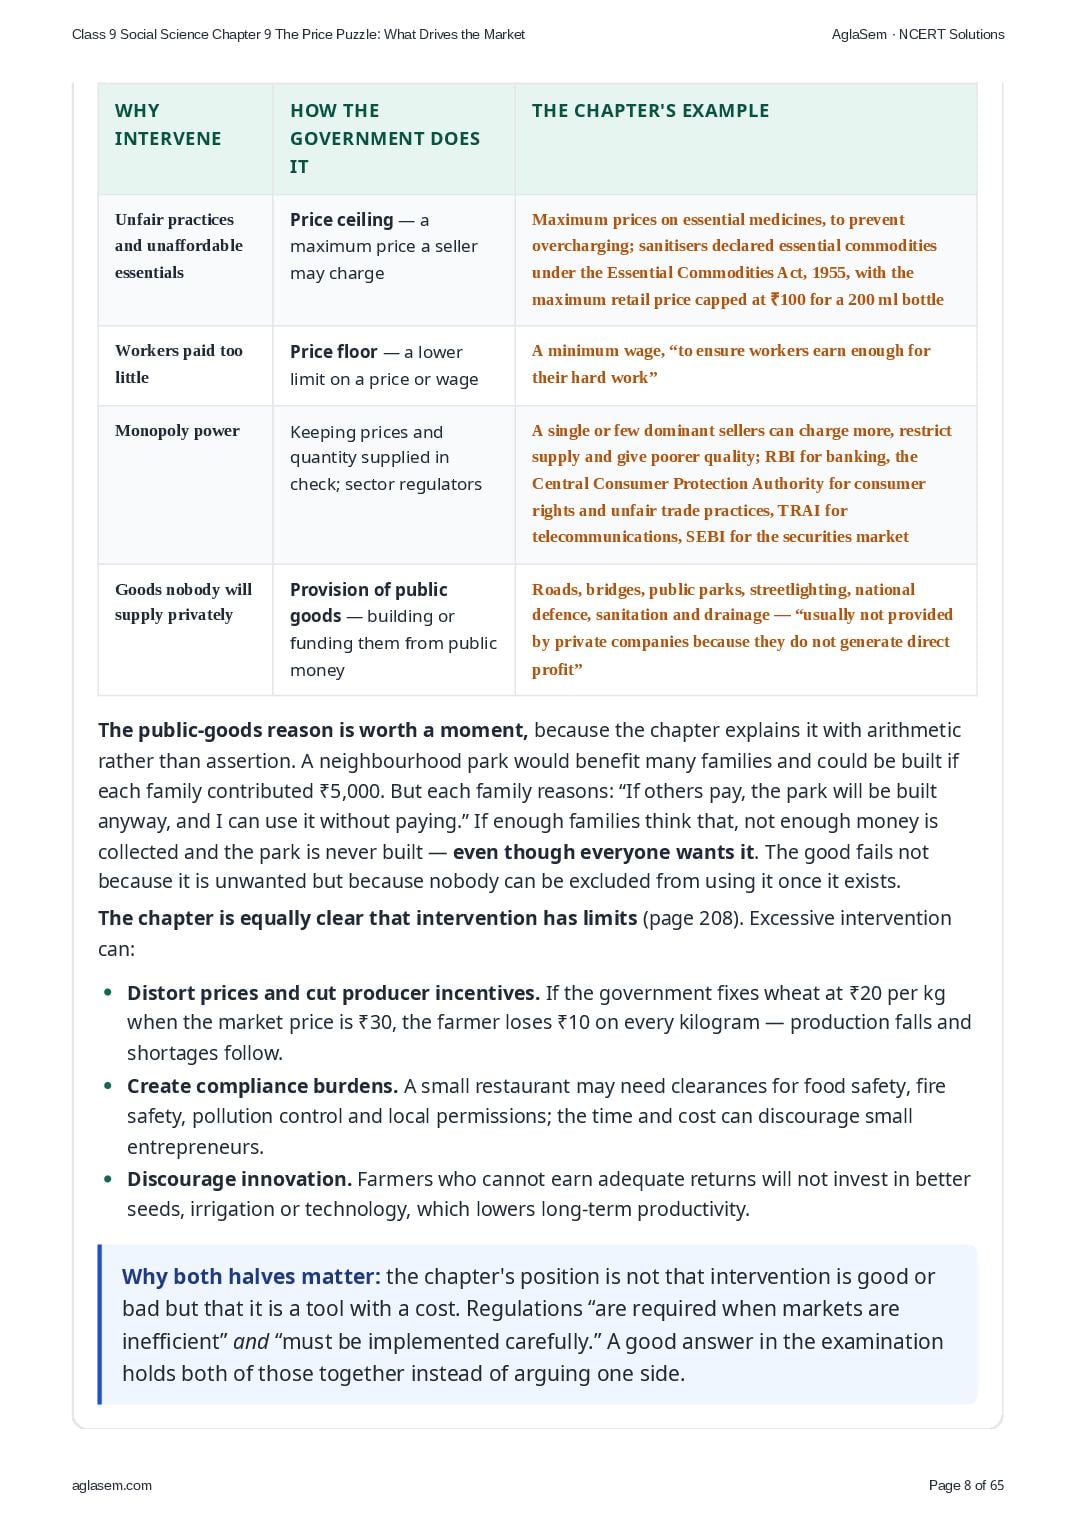
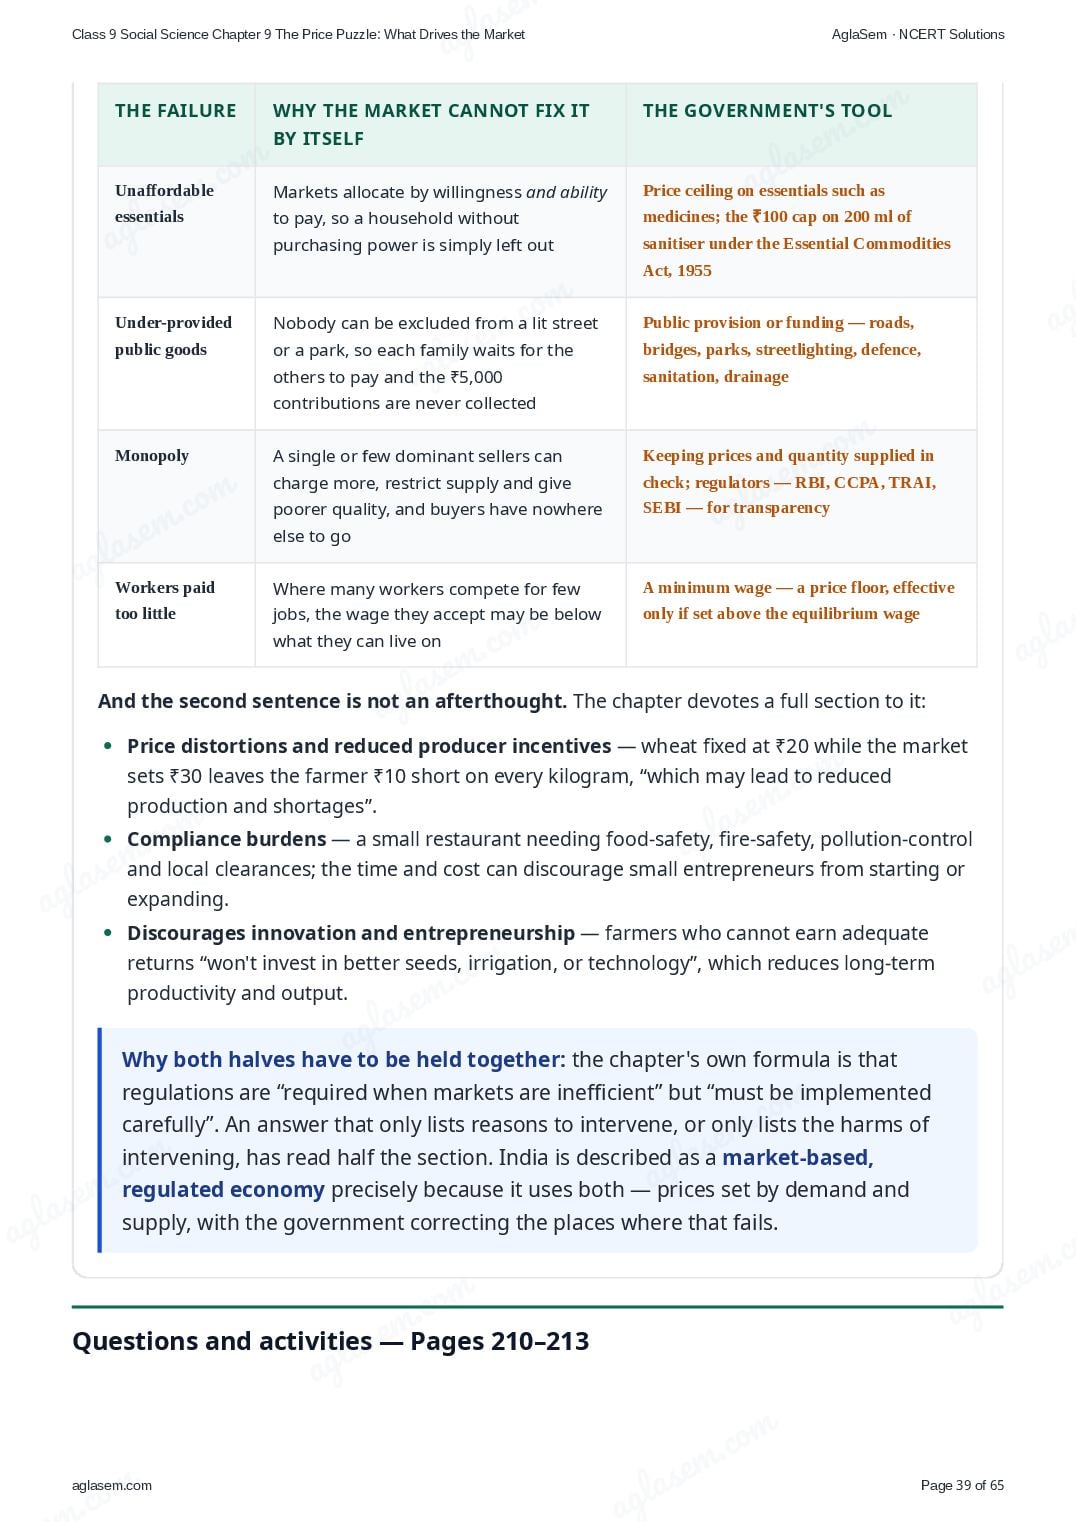
- Government intervenes when markets fail and produce unfair outcomes (unaffordable essentials), under-provide public goods, and enable monopolies. However, excessive government regulations may also have adverse effects.
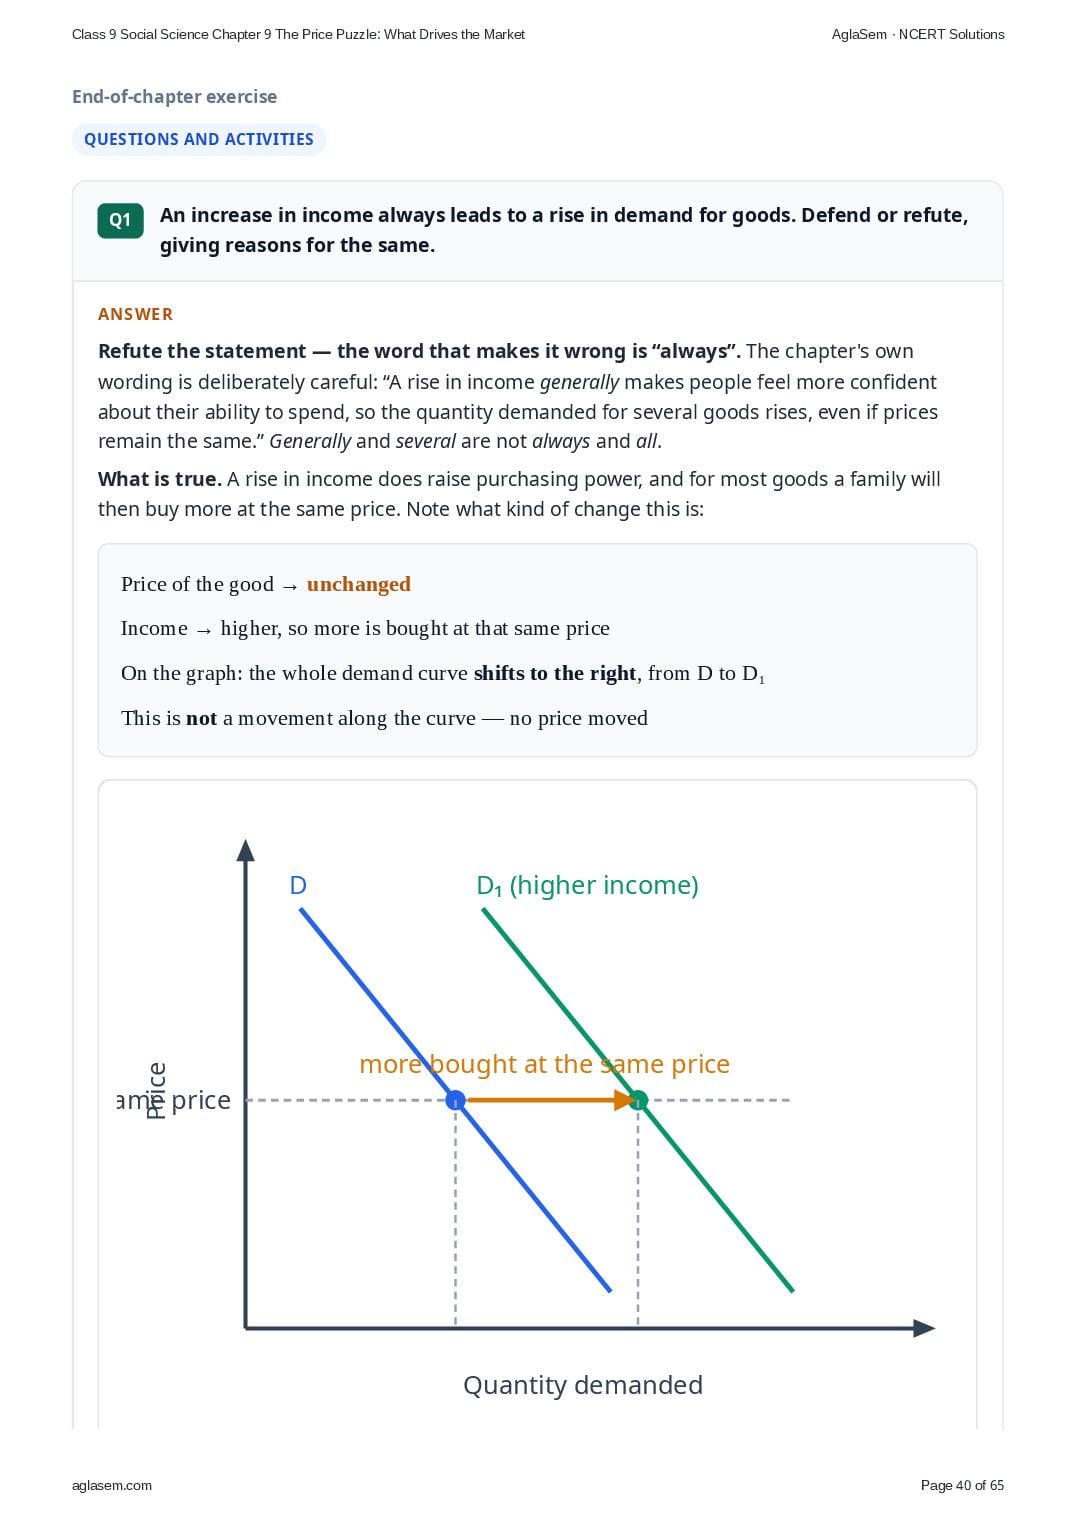
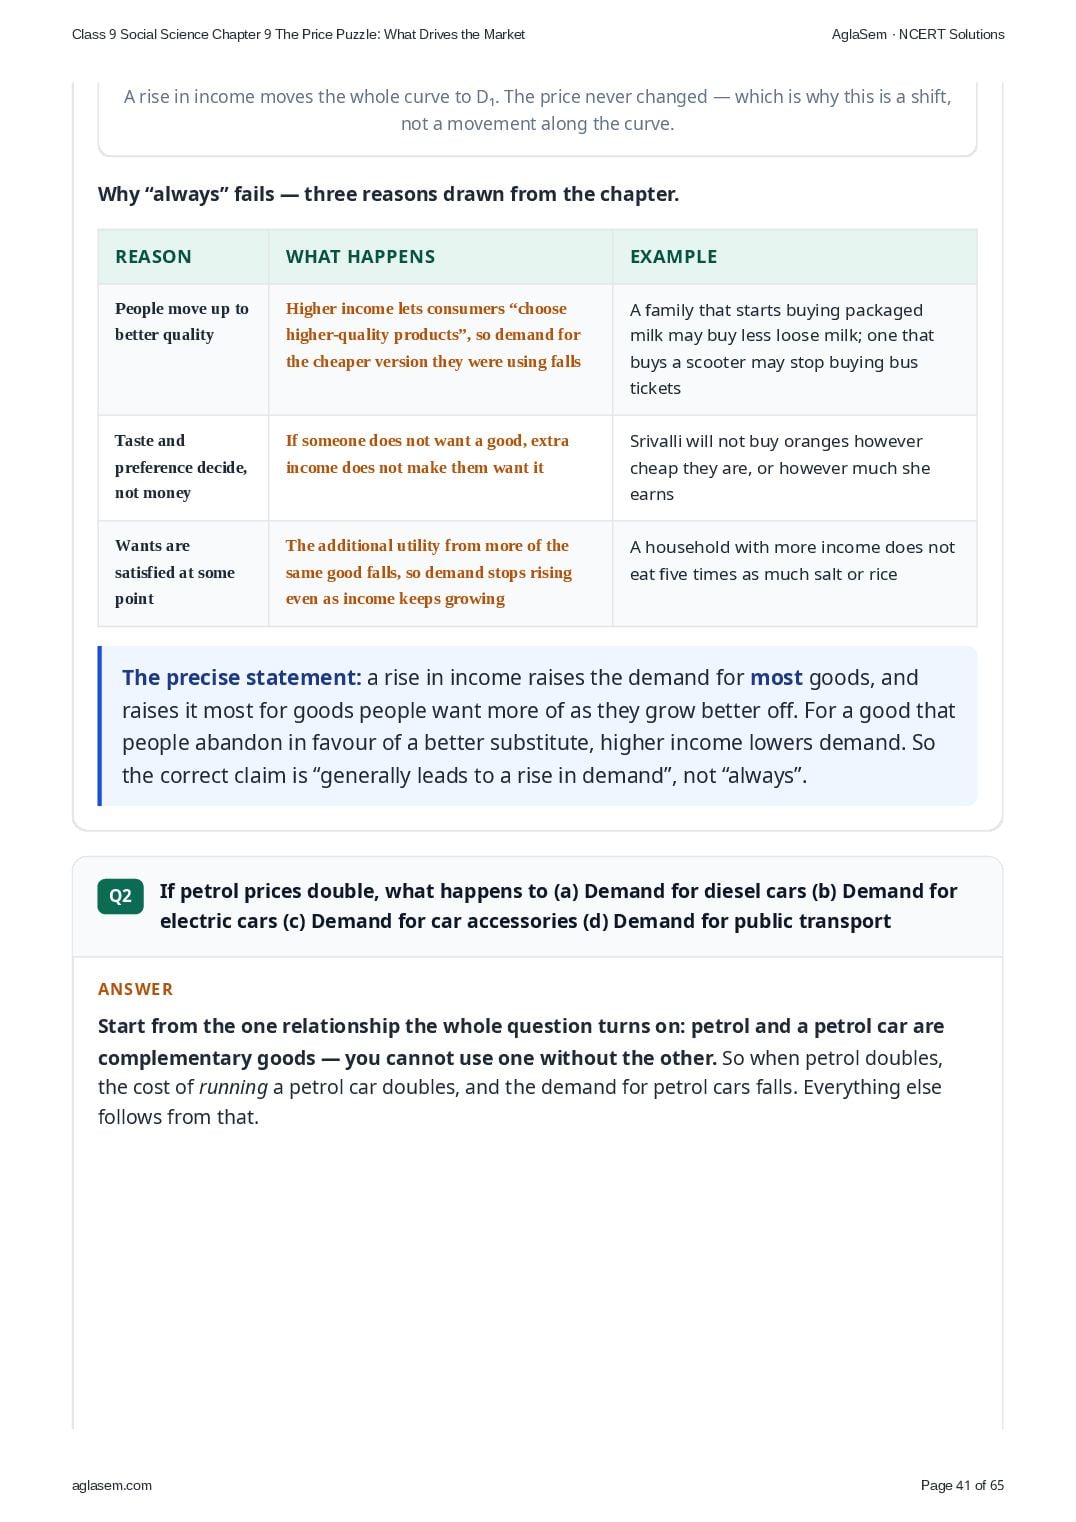
- An increase in income always leads to a rise in demand for goods. Defend or refute, giving reasons for the same.
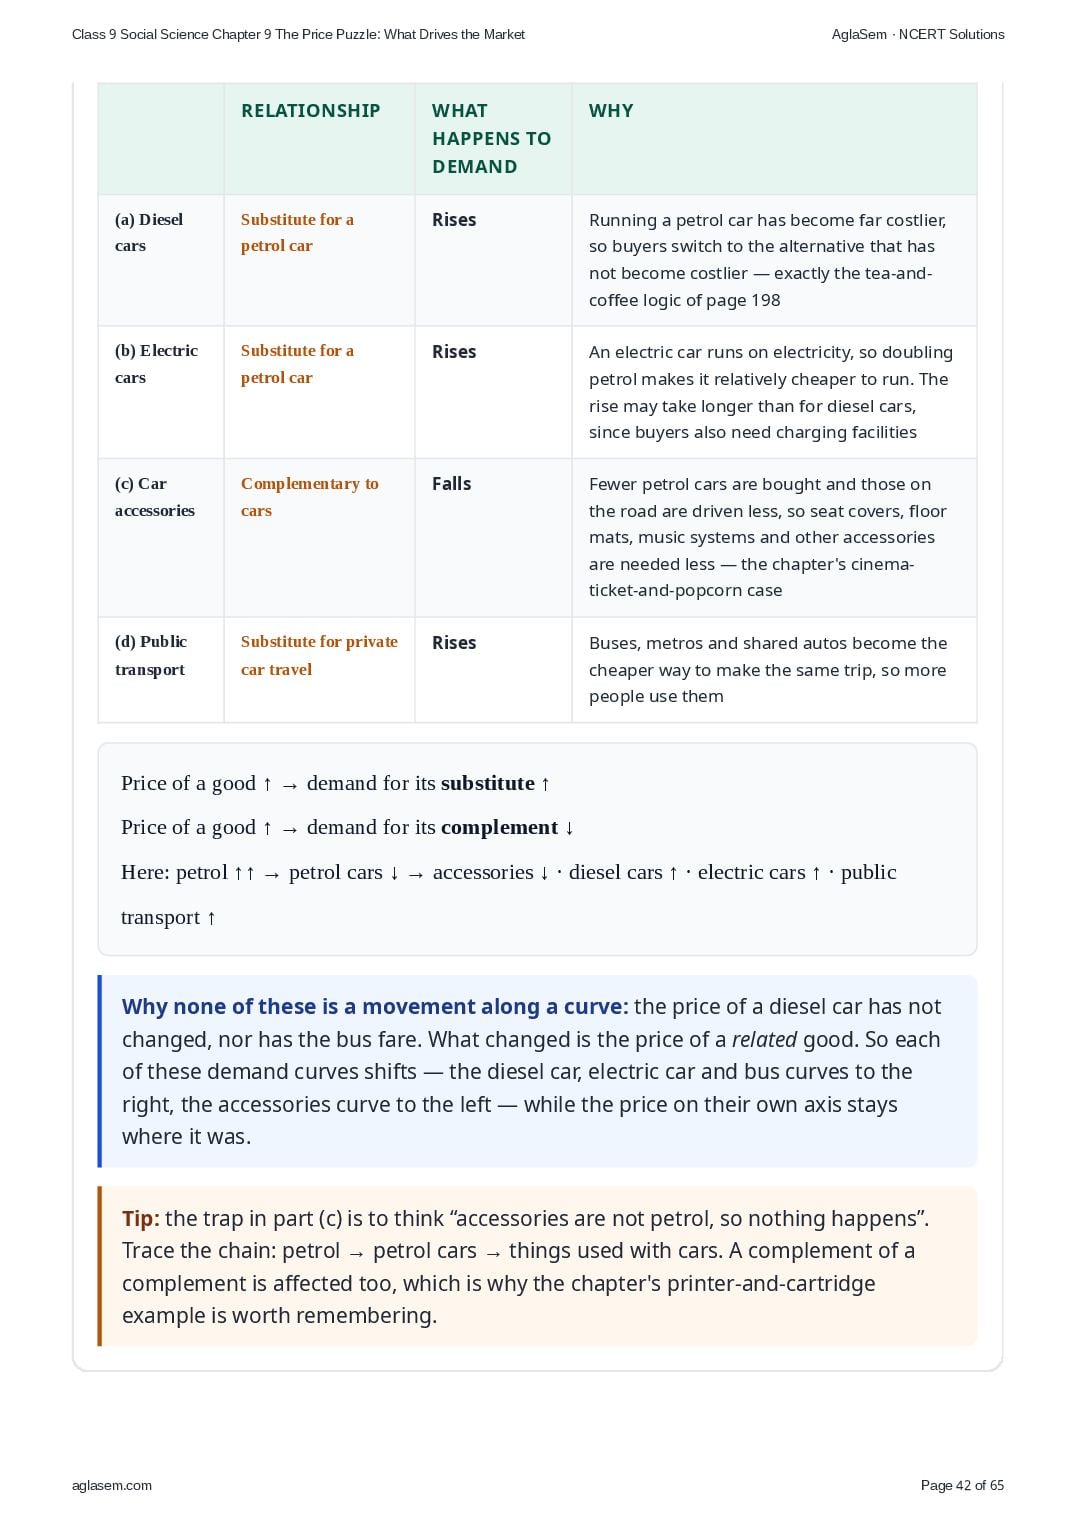
- If petrol prices double, what happens to (a) Demand for diesel cars (b) Demand for electric cars (c) Demand for car accessories (d) Demand for public transport
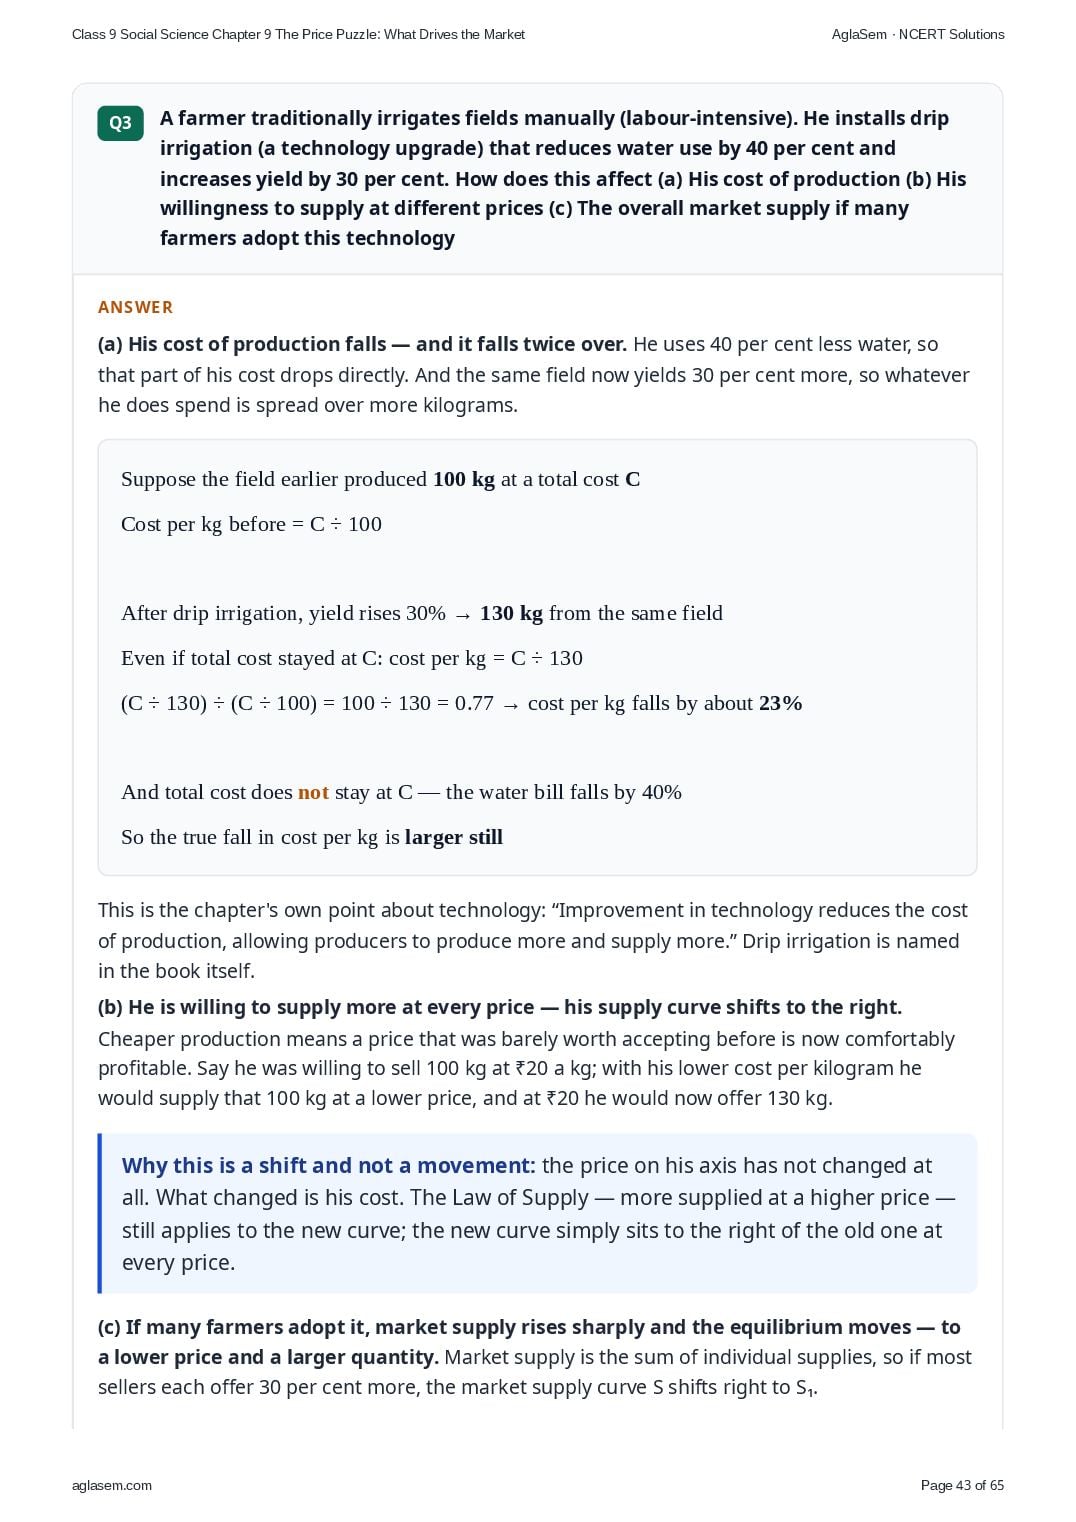
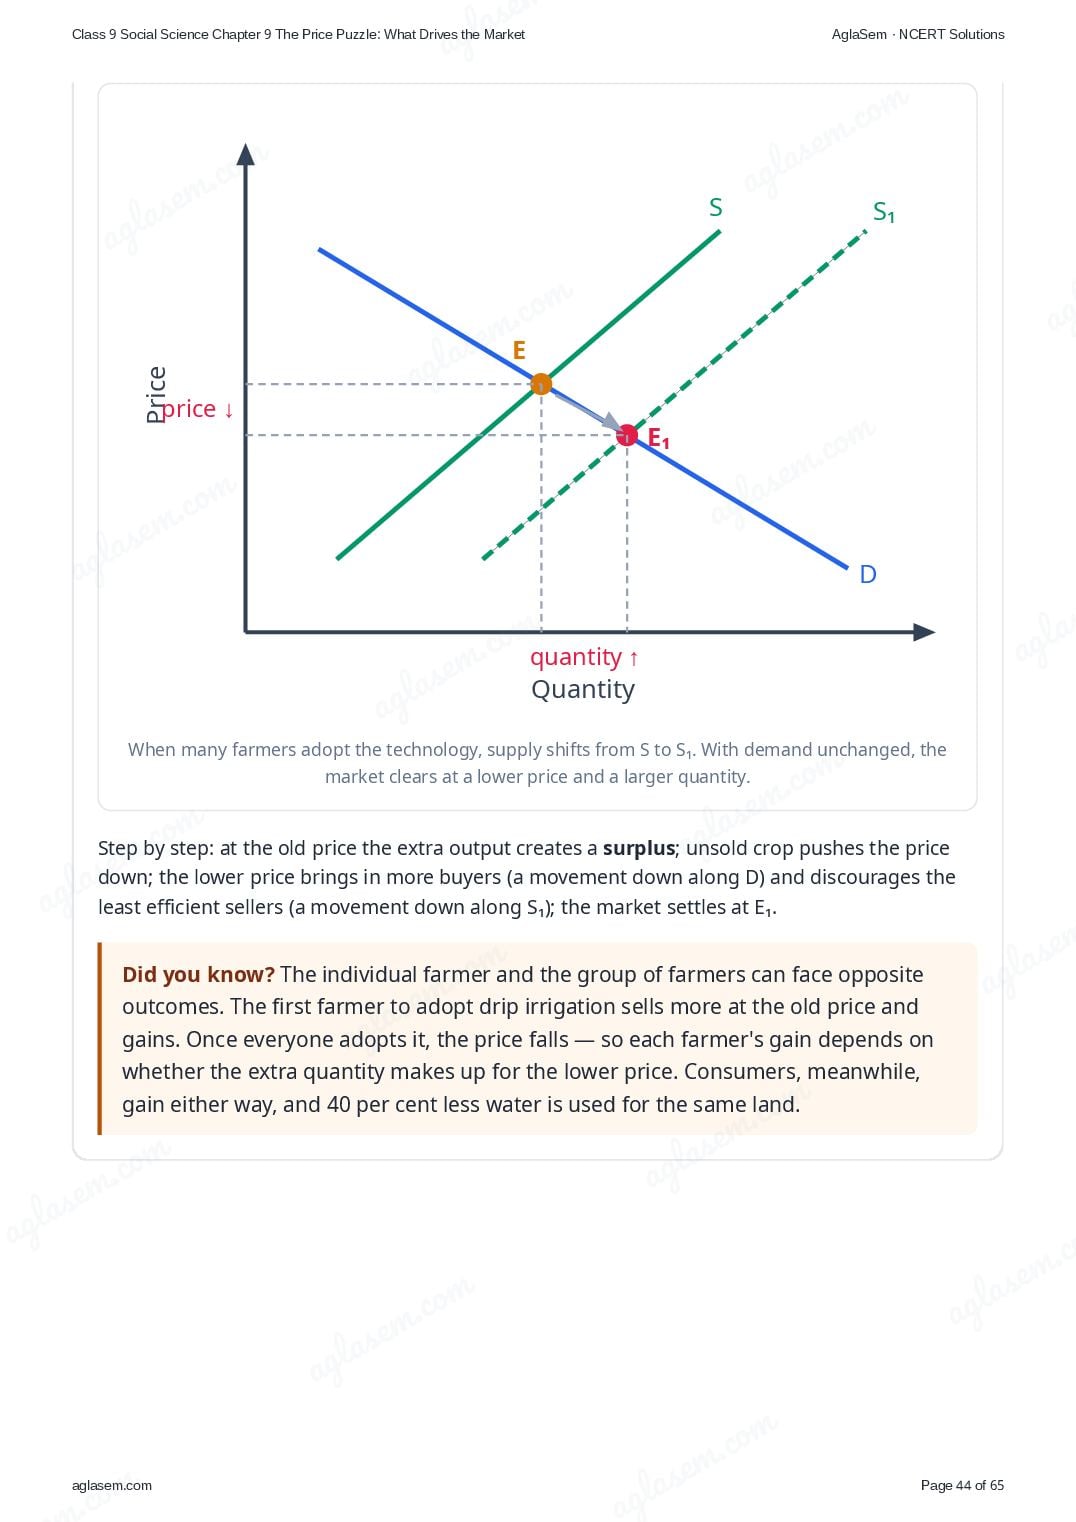
- A farmer traditionally irrigates fields manually (labour-intensive). He installs drip irrigation (a technology upgrade) that reduces water use by 40 per cent and increases yield by 30 per cent. How does this affect (a) His cost of production (b) His willingness to supply at different prices (c) The overall market supply if many farmers adopt this technology
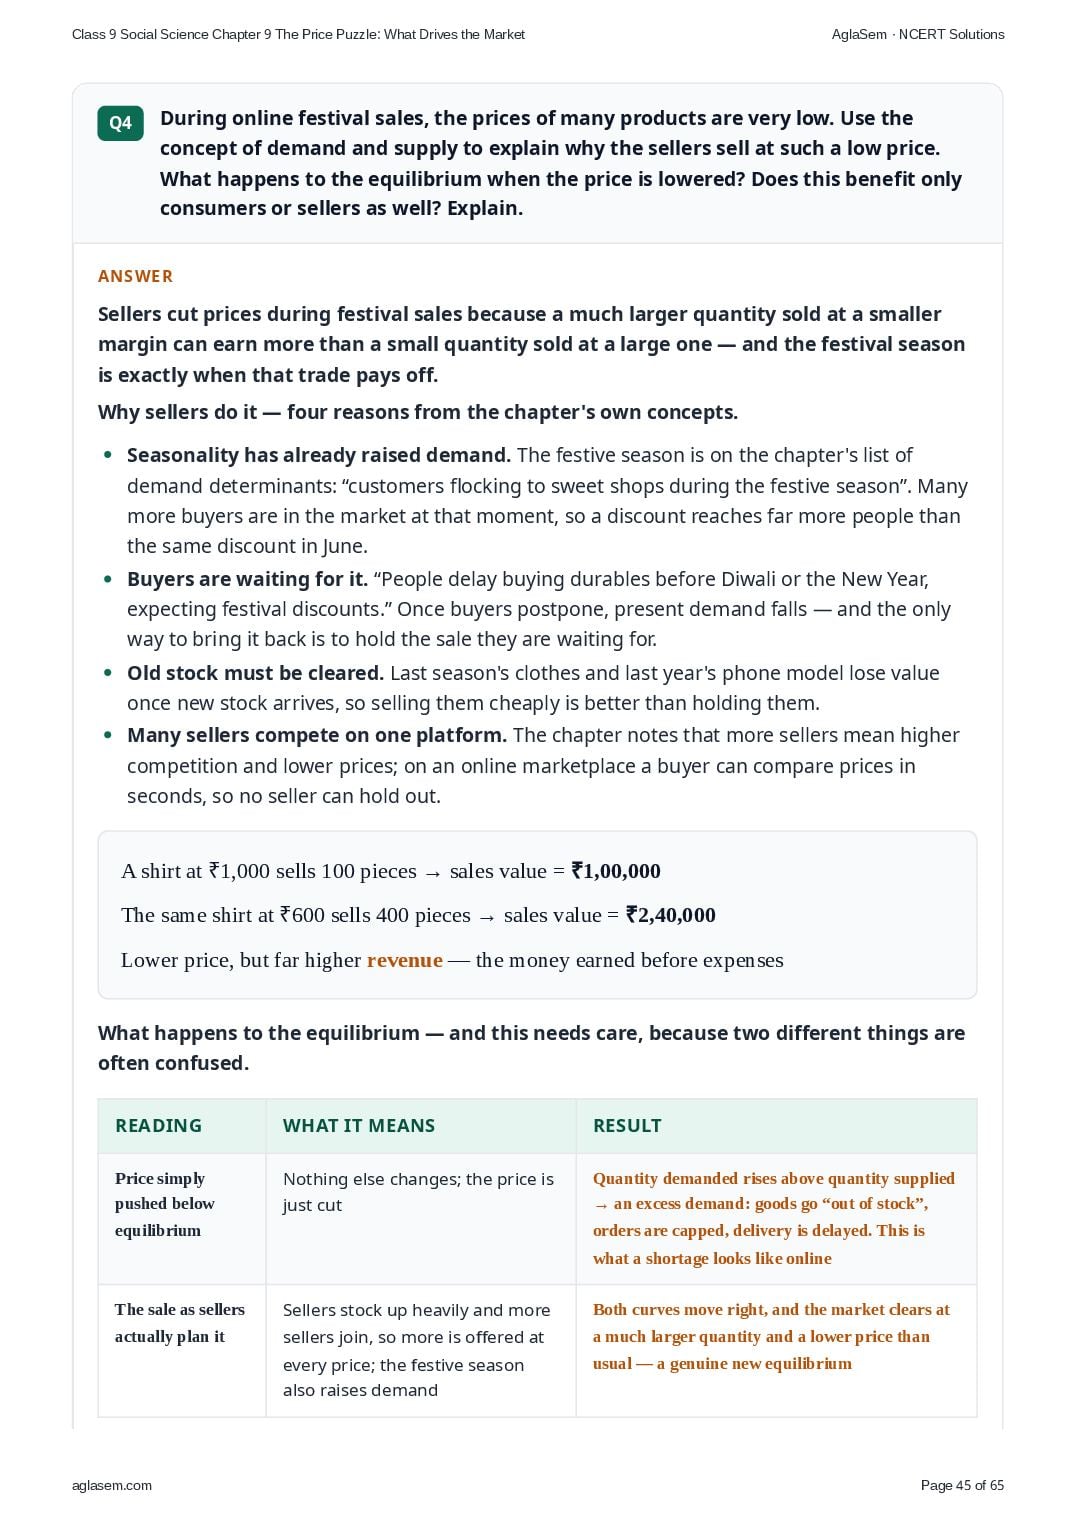
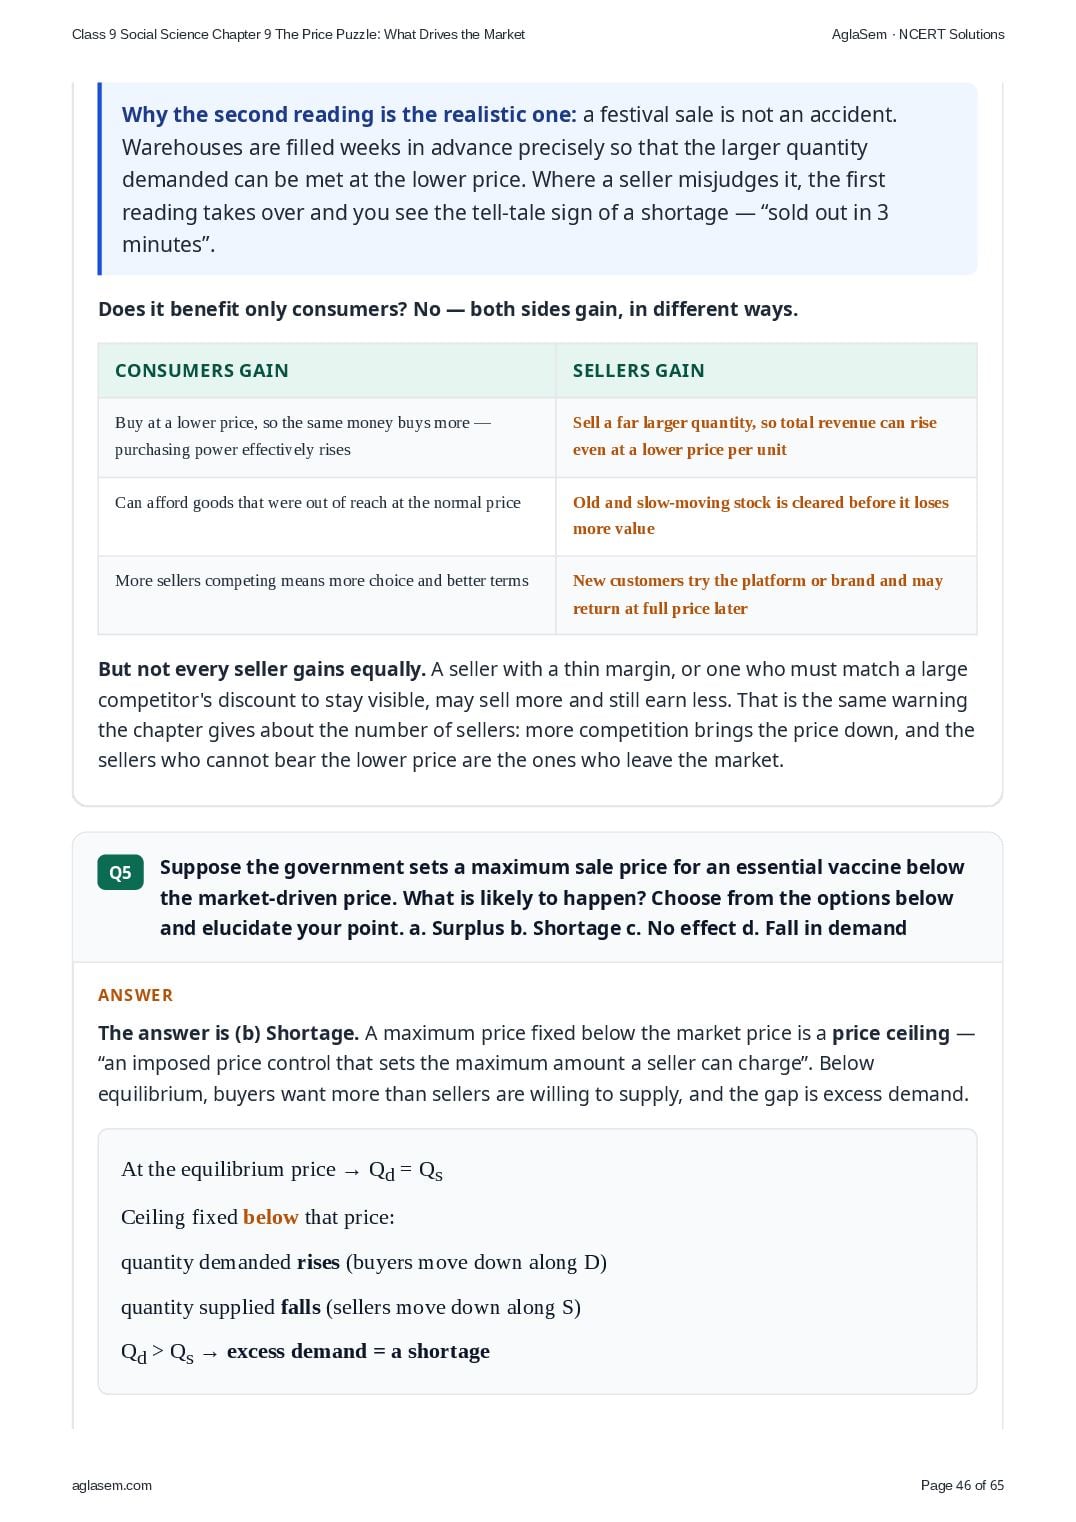
- During online festival sales, the prices of many products are very low. Use the concept of demand and supply to explain why the sellers sell at such a low price. What happens to the equilibrium when the price is lowered? Does this benefit only consumers or sellers as well? Explain.
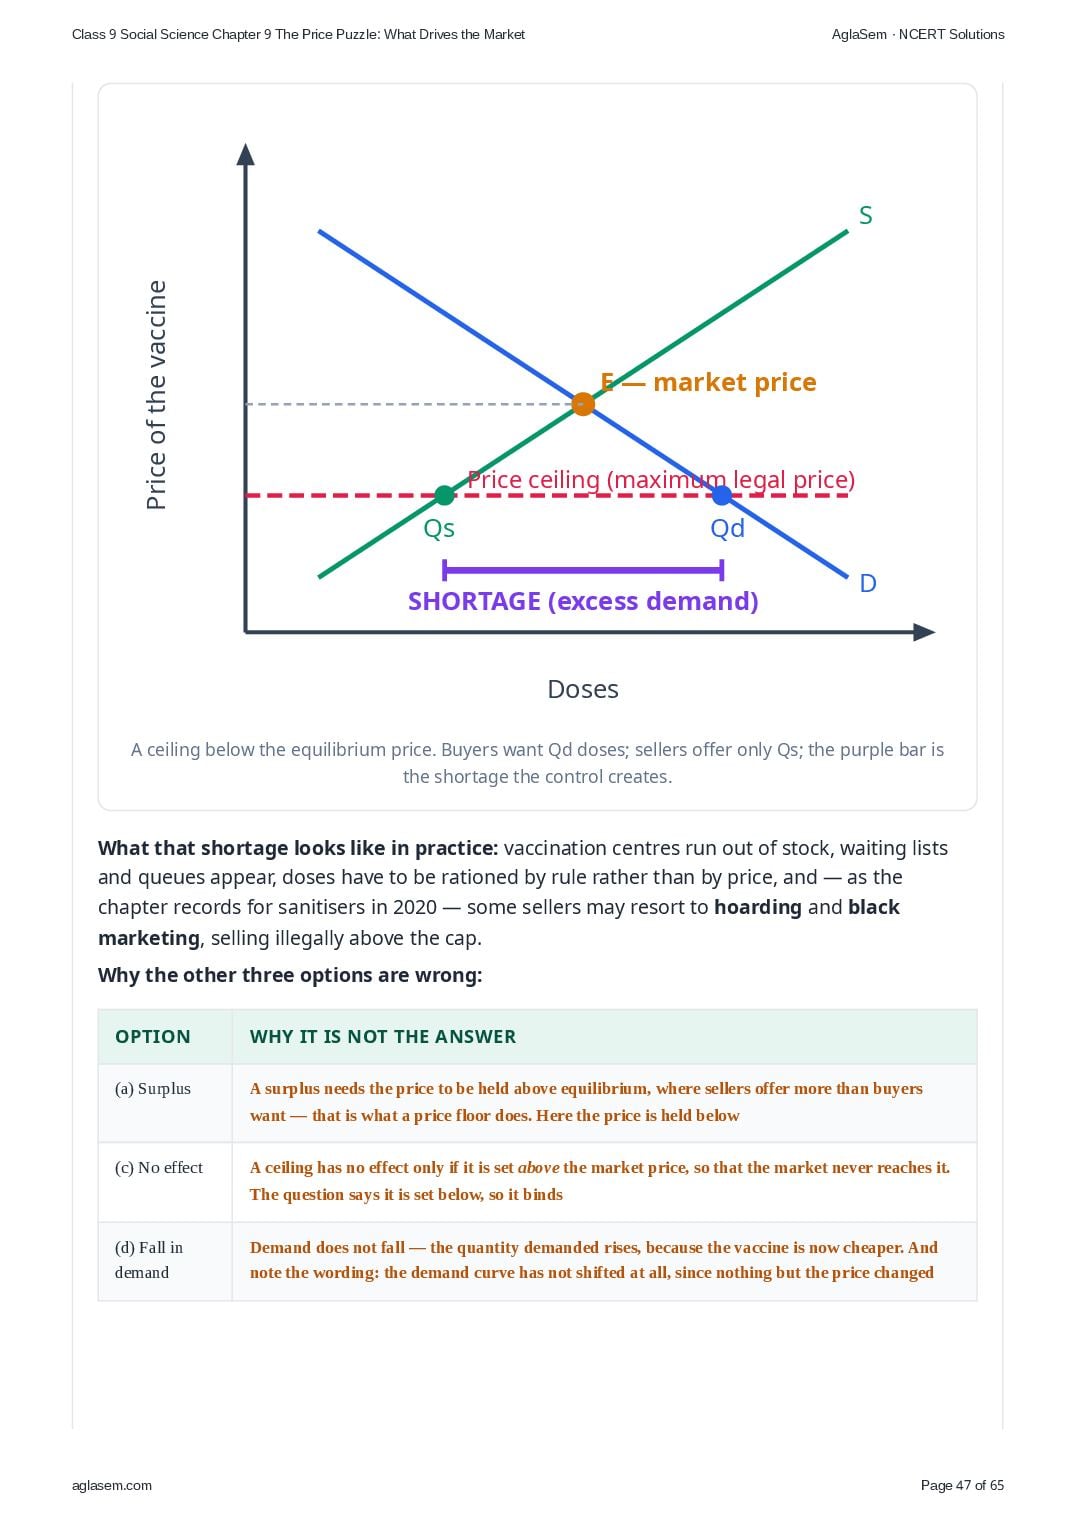
- Suppose the government sets a maximum sale price for an essential vaccine below the market-driven price. What is likely to happen? Choose from the options below and elucidate your point. a. Surplus b. Shortage c. No effect d. Fall in demand
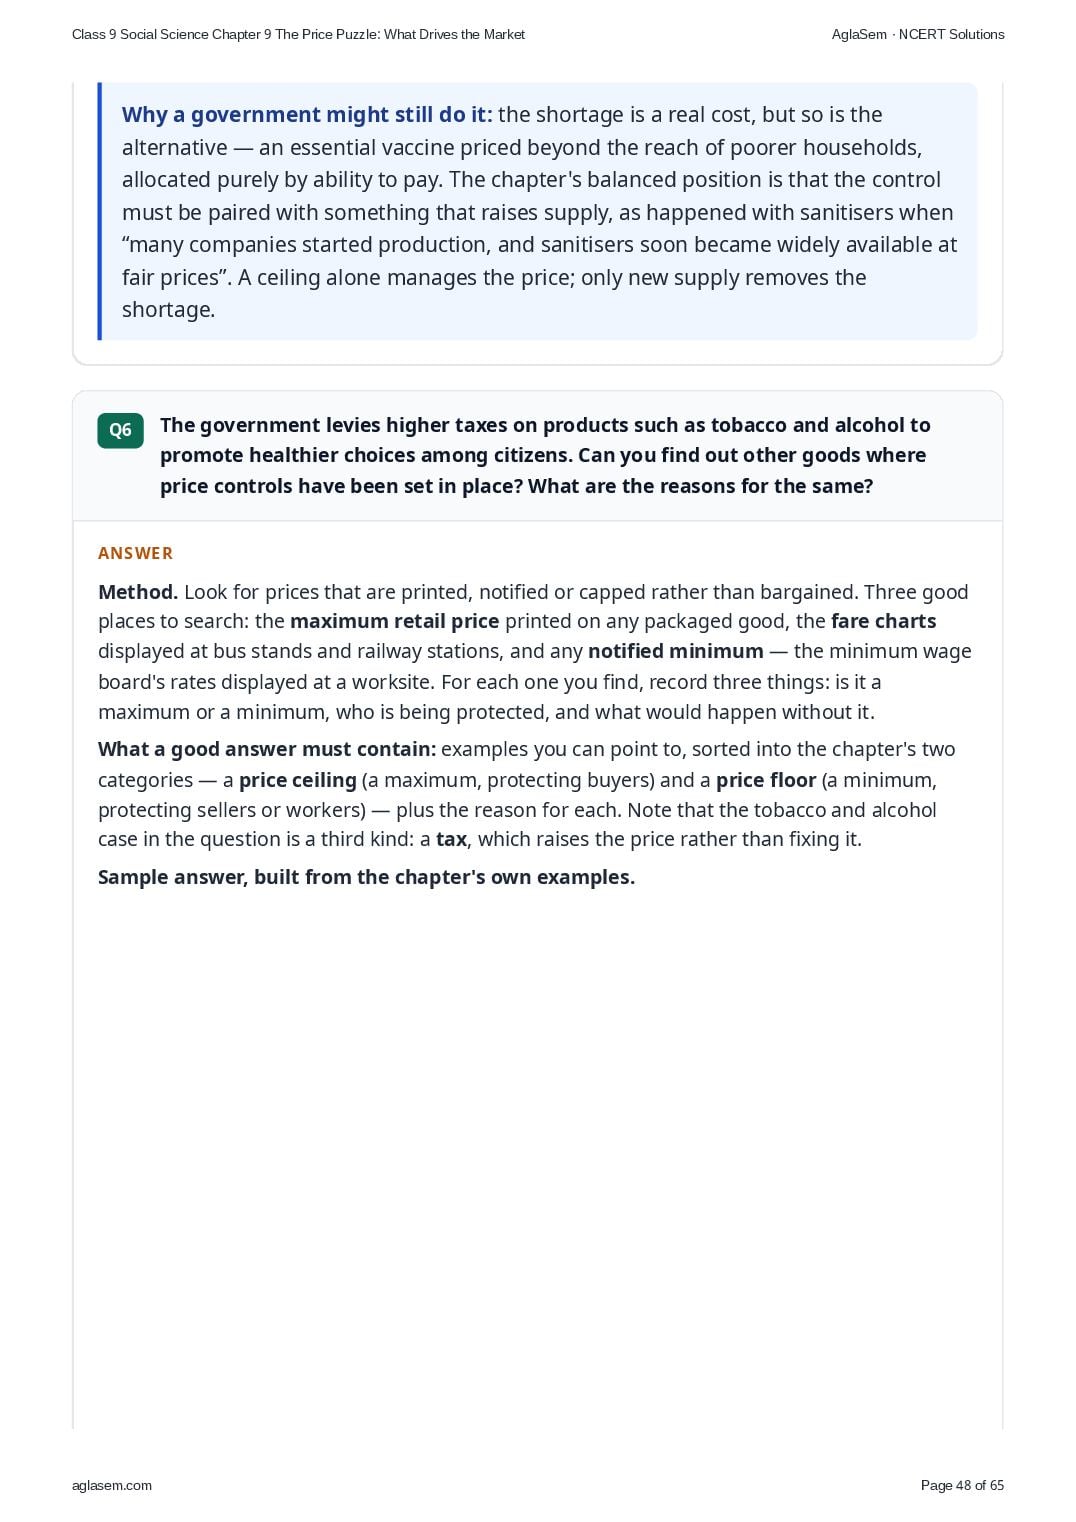
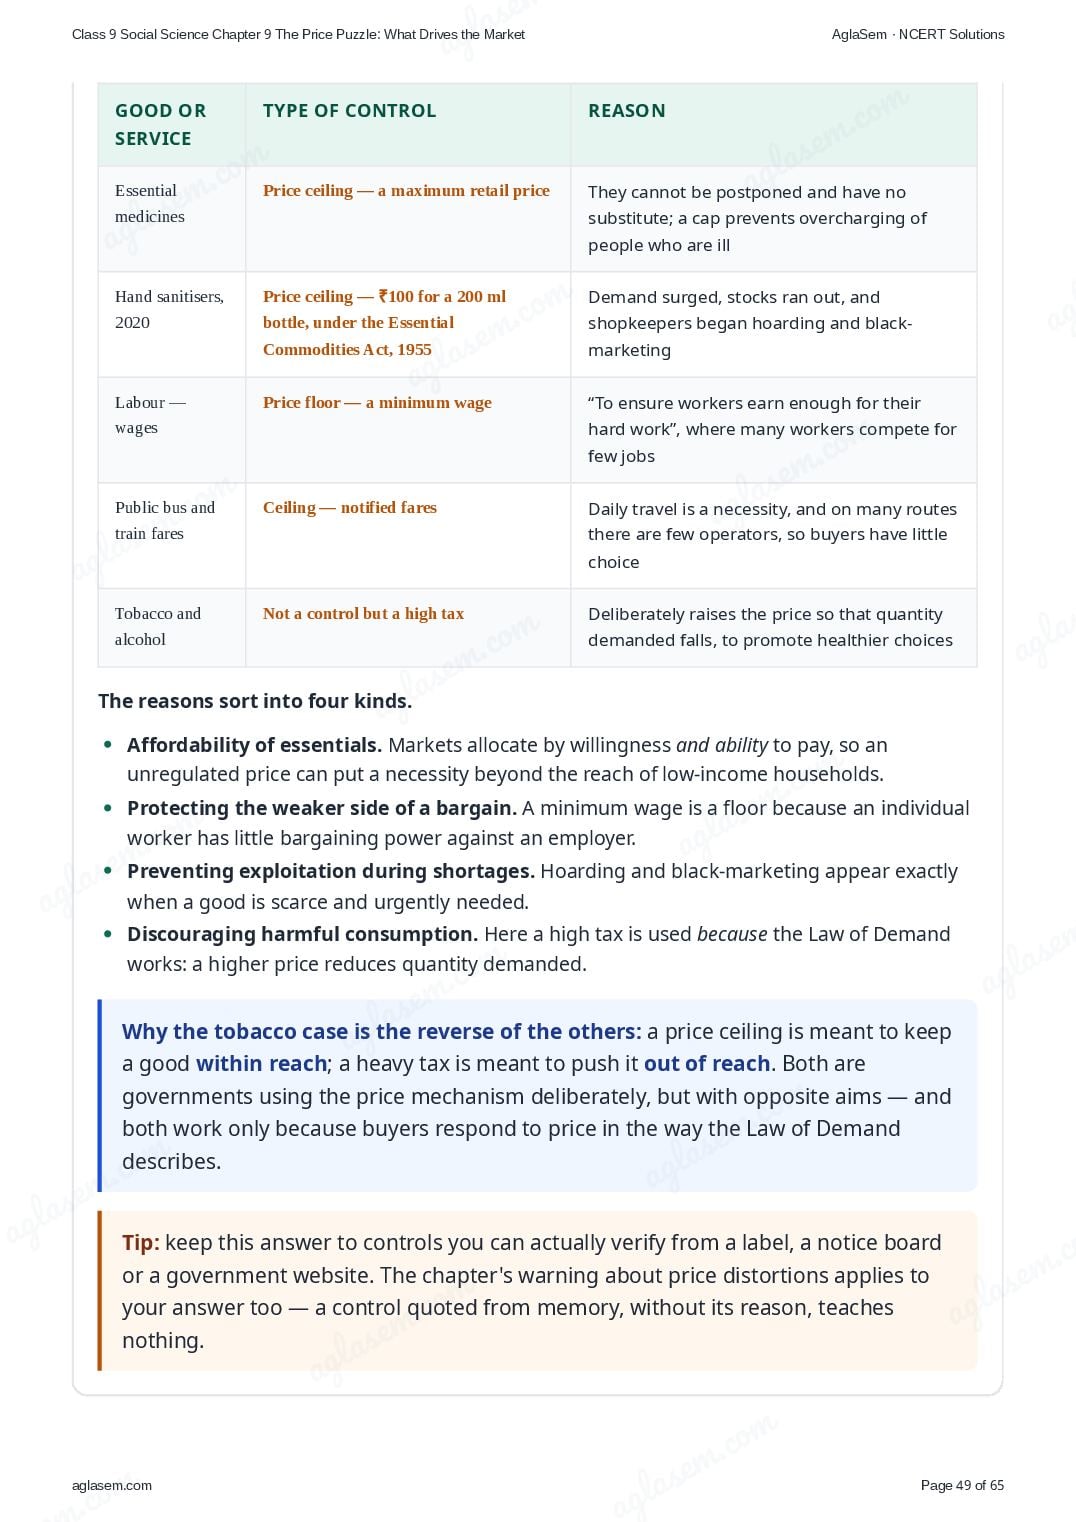
- The government levies higher taxes on products such as tobacco and alcohol to promote healthier choices among citizens. Can you find out other goods where price controls have been set in place? What are the reasons for the same?
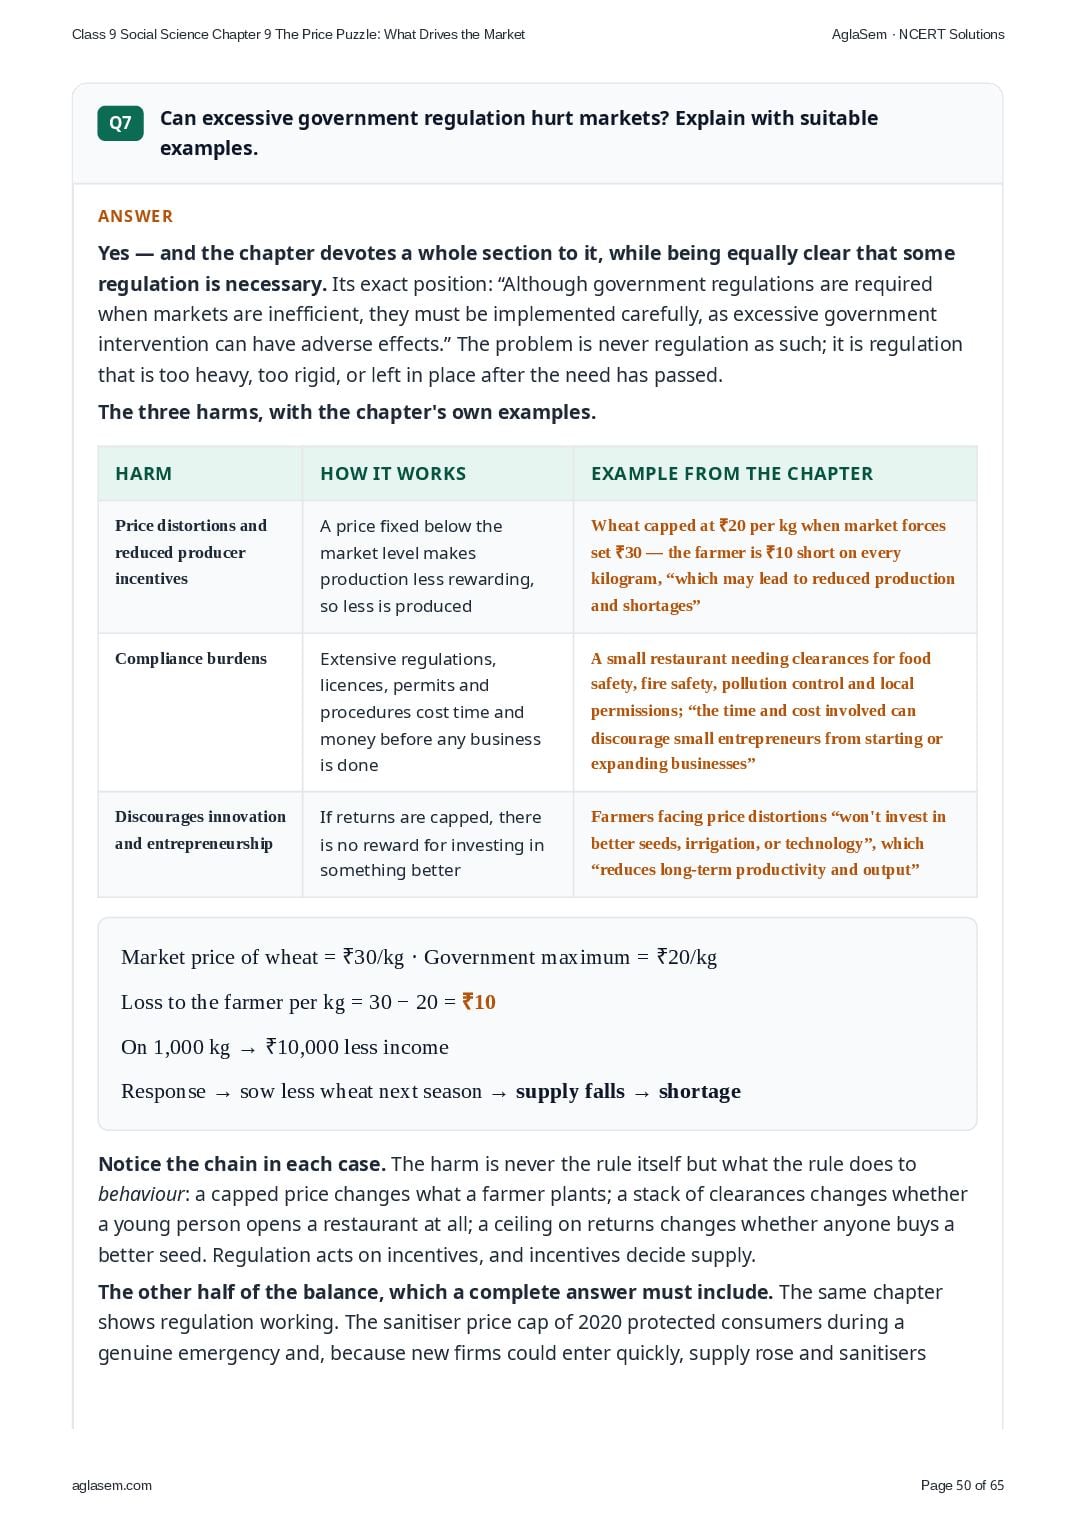
- Can excessive government regulation hurt markets? Explain with suitable examples.
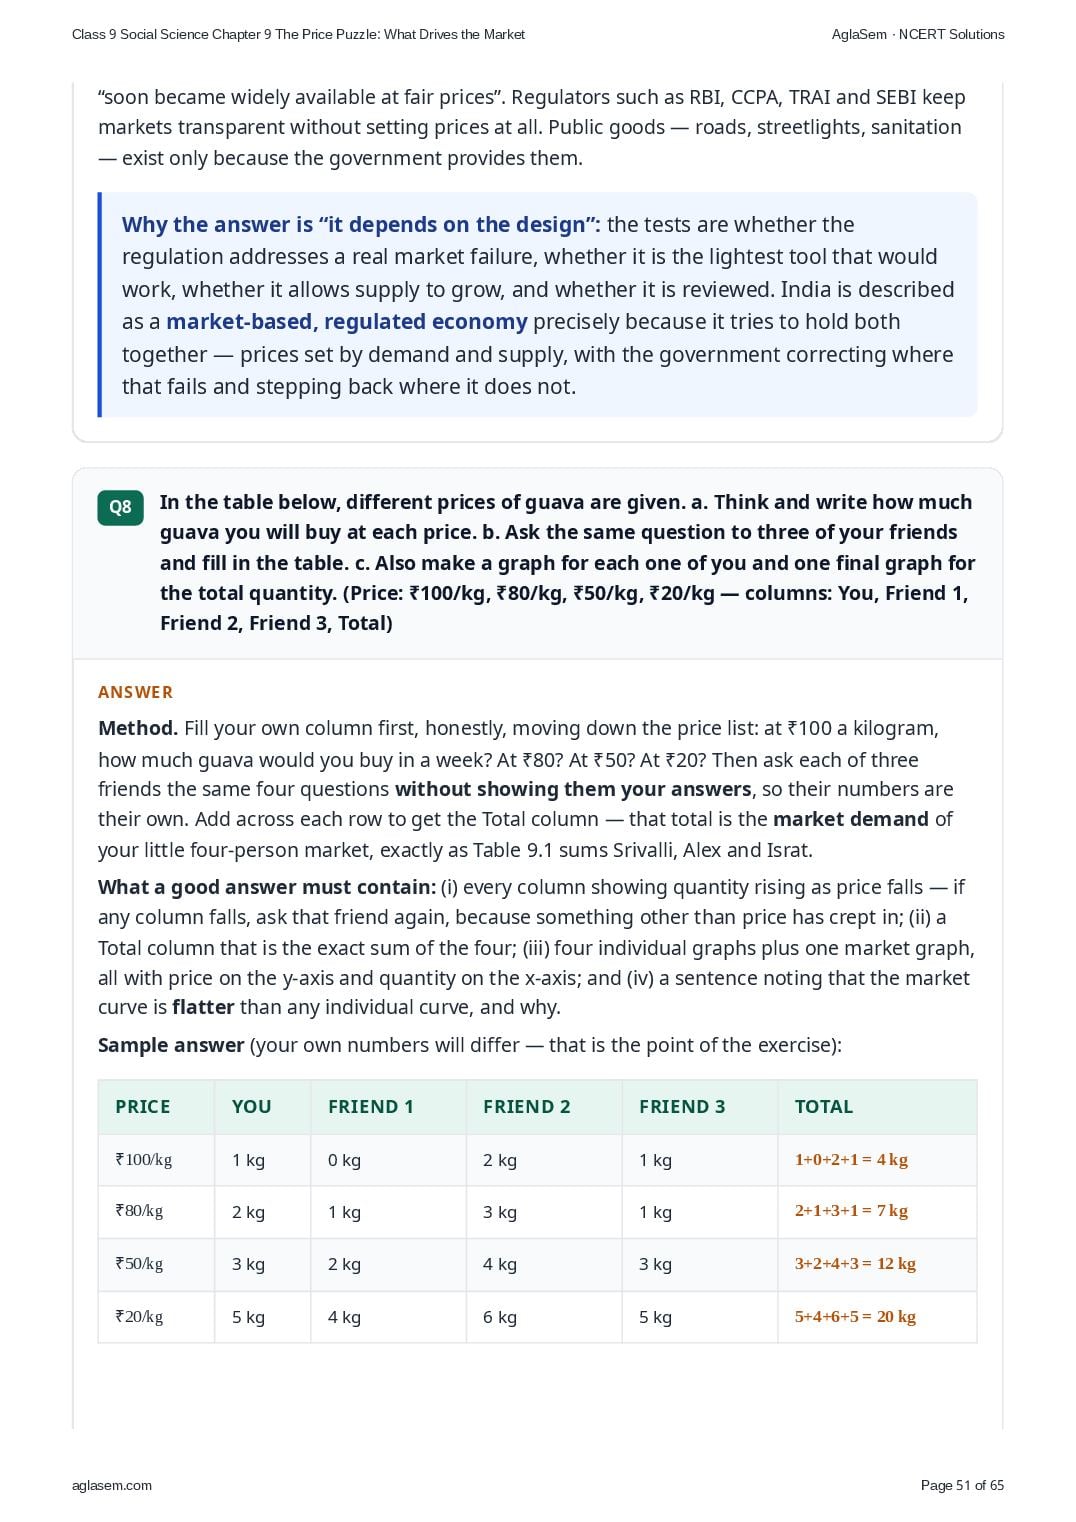
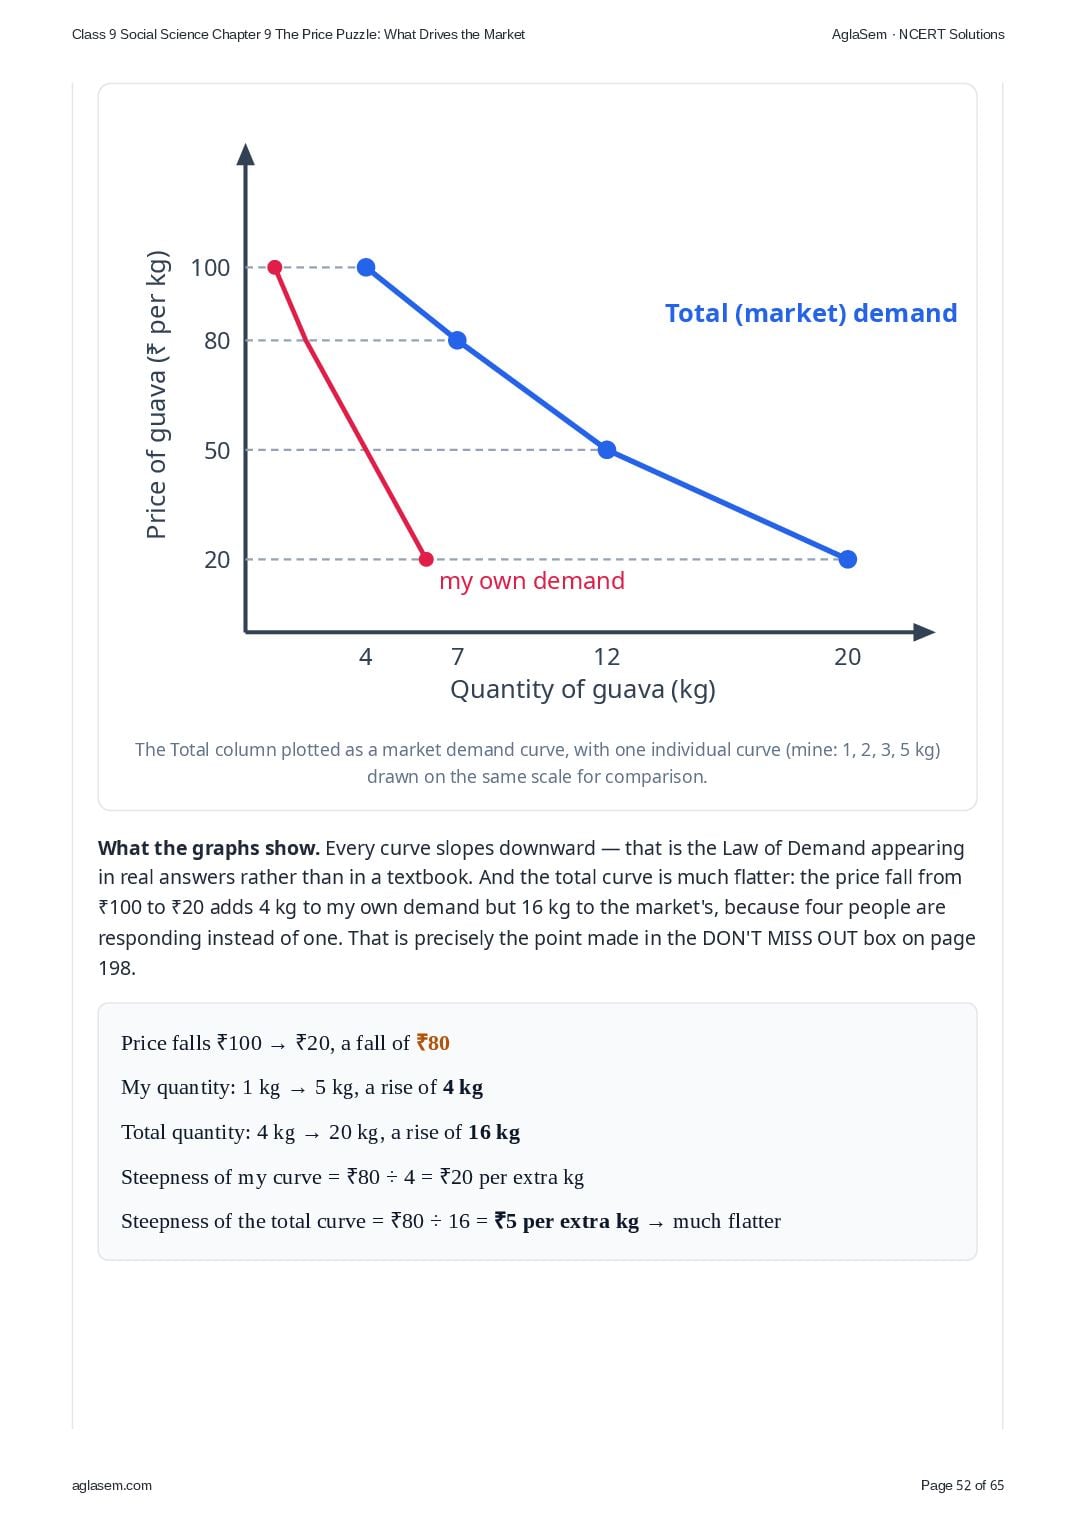
- In the table below, different prices of guava are given. a. Think and write how much guava you will buy at each price. b. Ask the same question to three of your friends and fill in the table. c. Also make a graph for each one of you and one final graph for the total quantity. (Price: ₹100/kg, ₹80/kg, ₹50/kg, ₹20/kg — columns: You, Friend 1, Friend 2, Friend 3, Total)
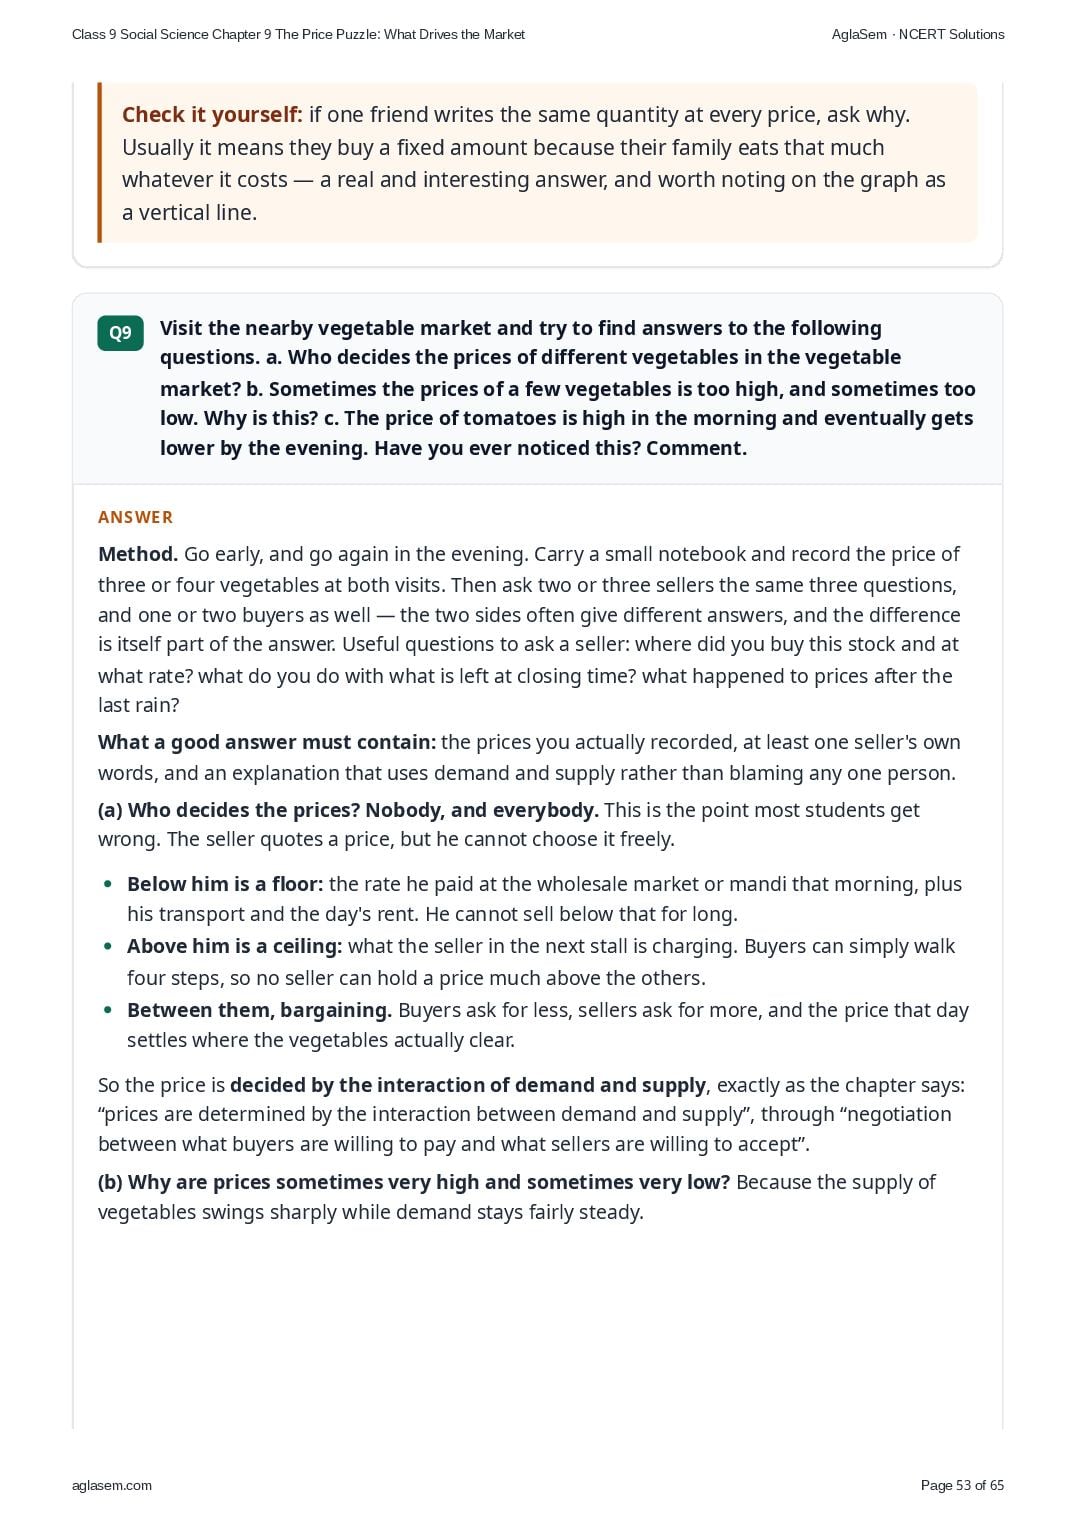
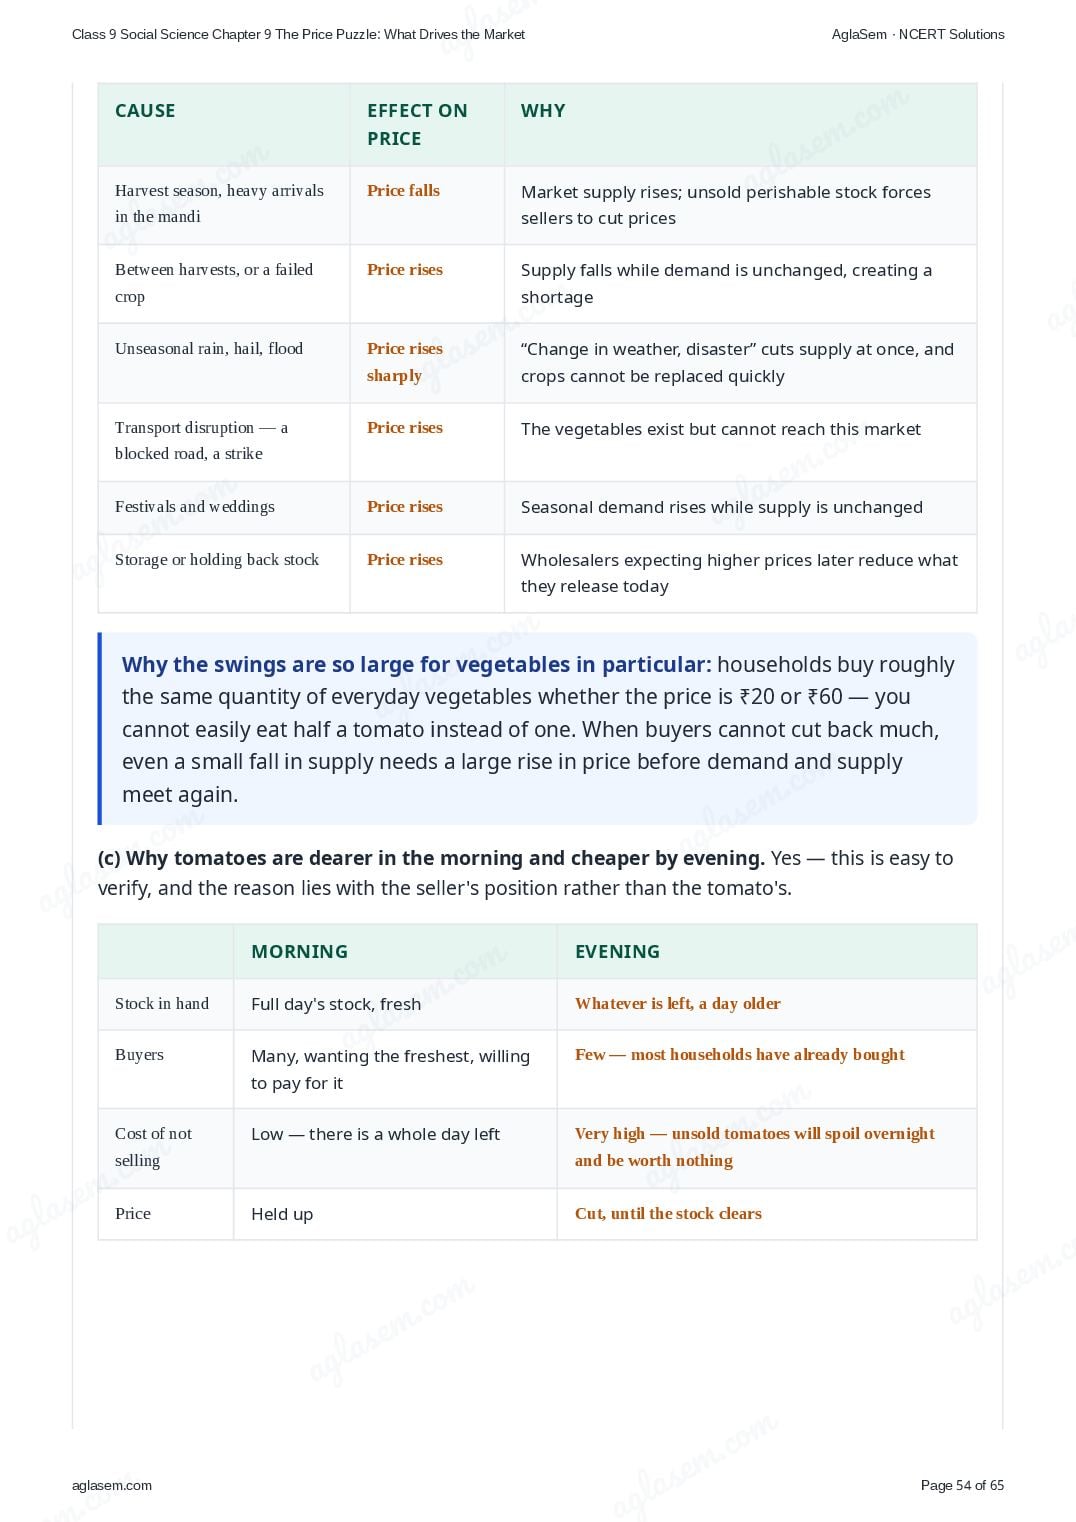
- Visit the nearby vegetable market and try to find answers to the following questions. a. Who decides the prices of different vegetables in the vegetable market? b. Sometimes the prices of a few vegetables is too high, and sometimes too low. Why is this? c. The price of tomatoes is high in the morning and eventually gets lower by the evening. Have you ever noticed this? Comment.
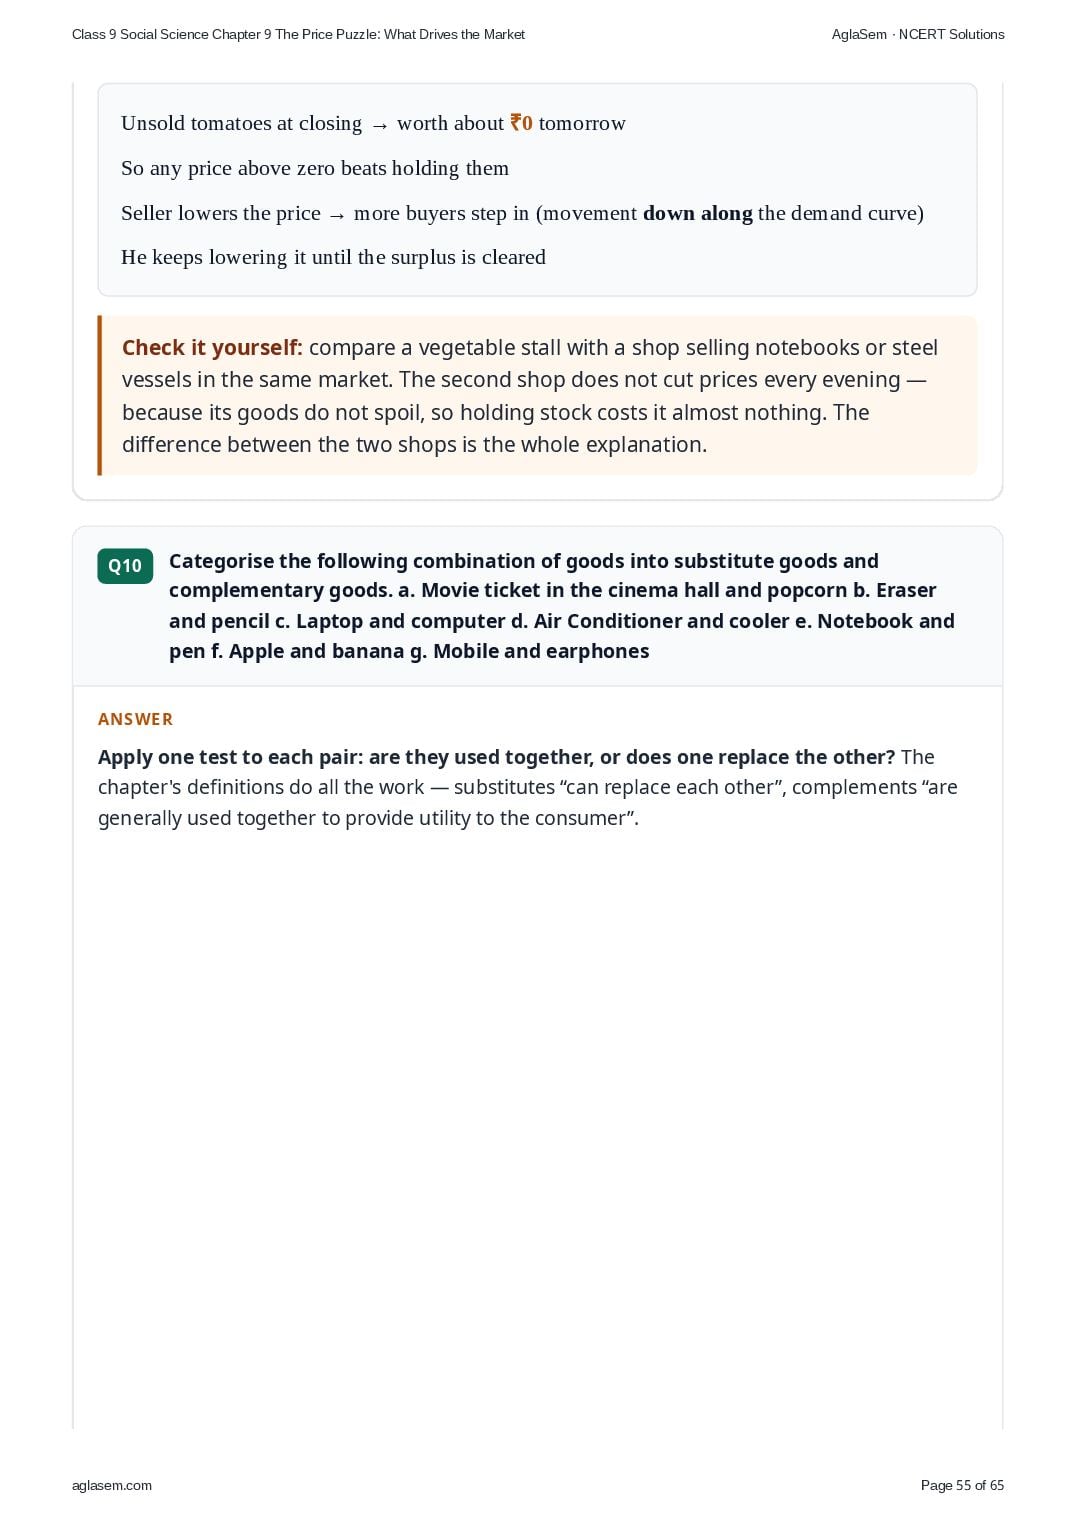
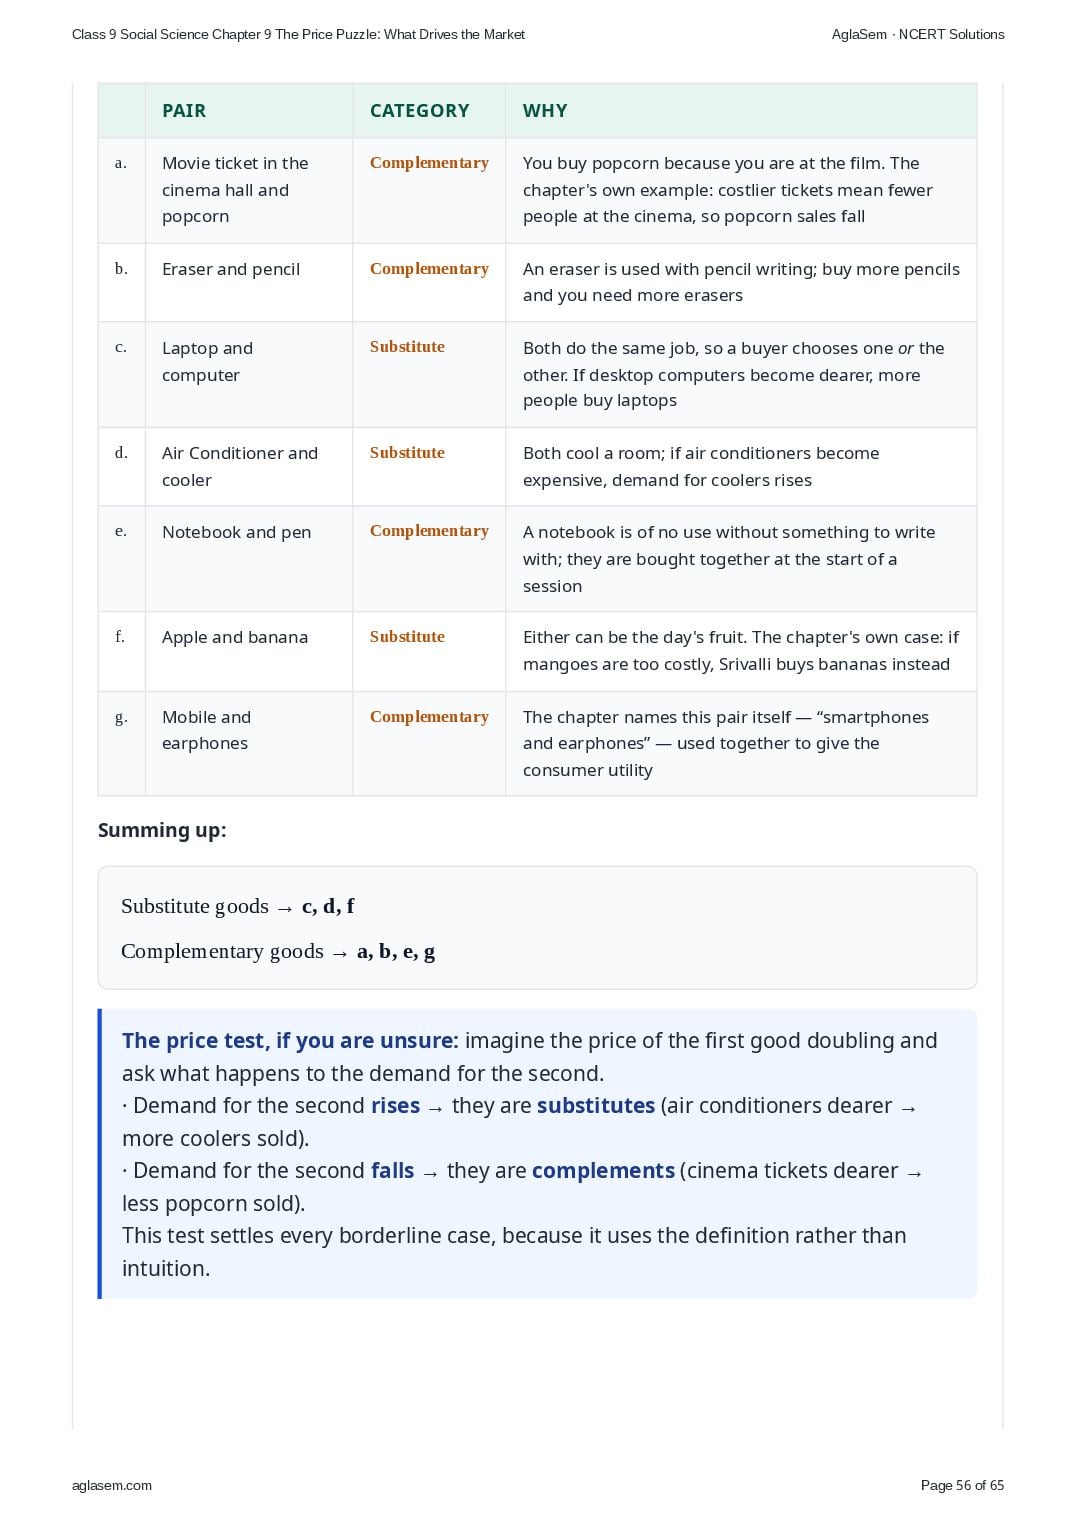
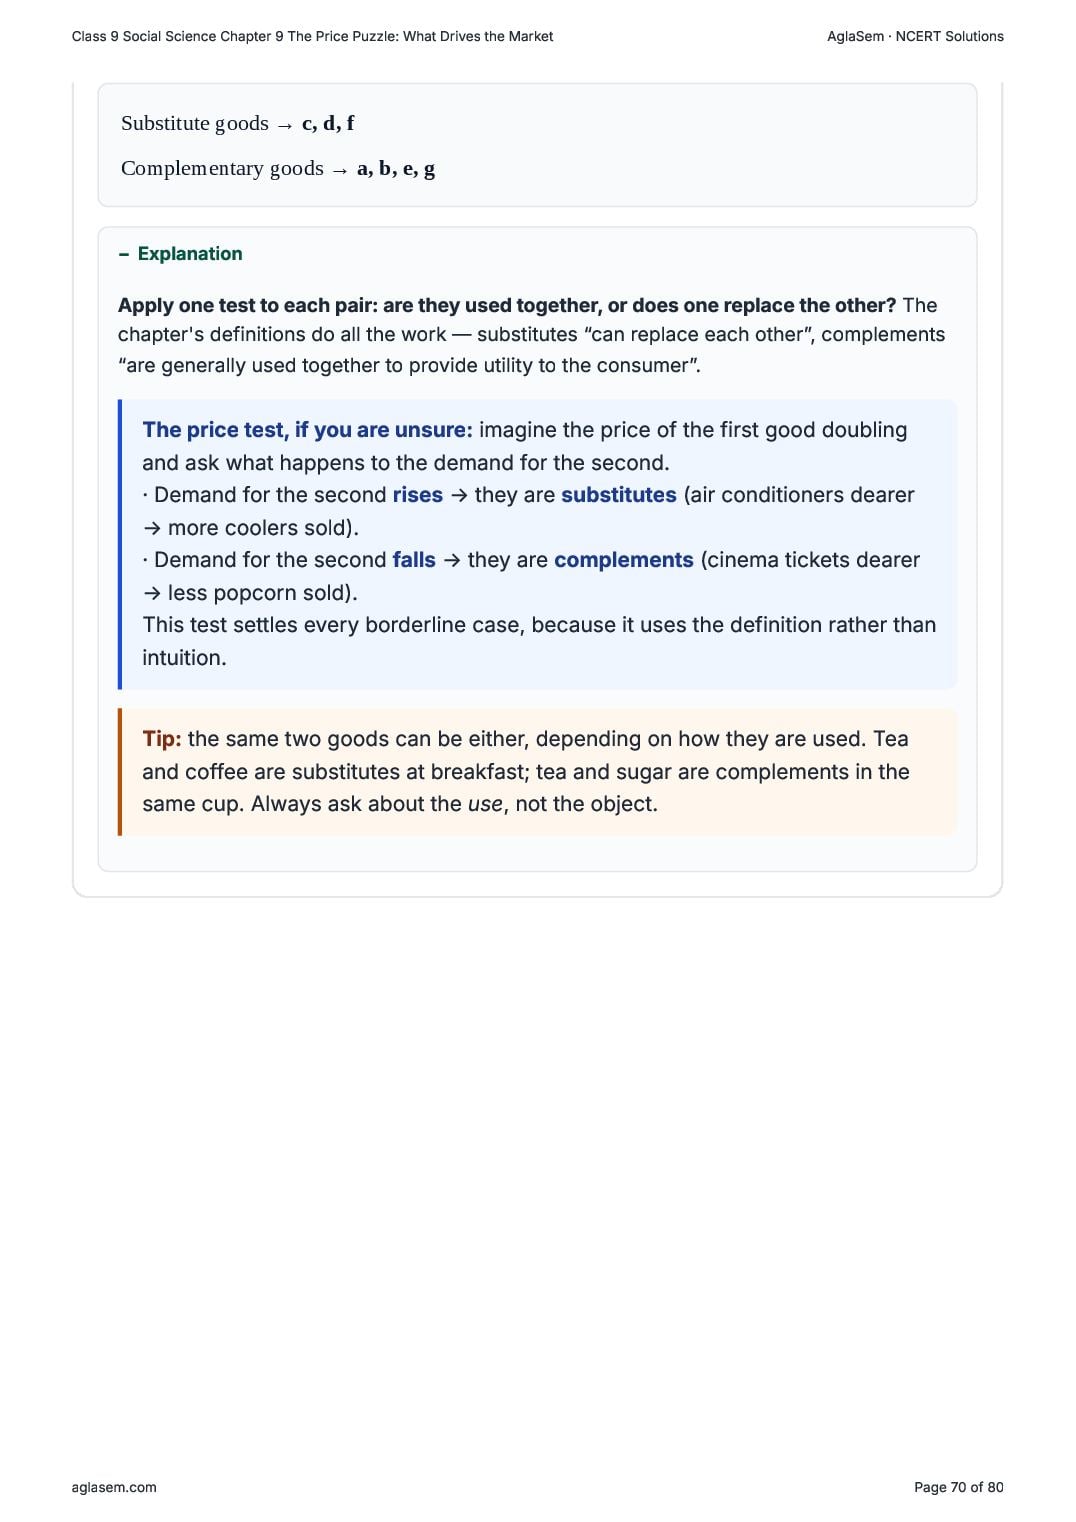
- Categorise the following combination of goods into substitute goods and complementary goods. a. Movie ticket in the cinema hall and popcorn b. Eraser and pencil c. Laptop and computer d. Air Conditioner and cooler e. Notebook and pen f. Apple and banana g. Mobile and earphones
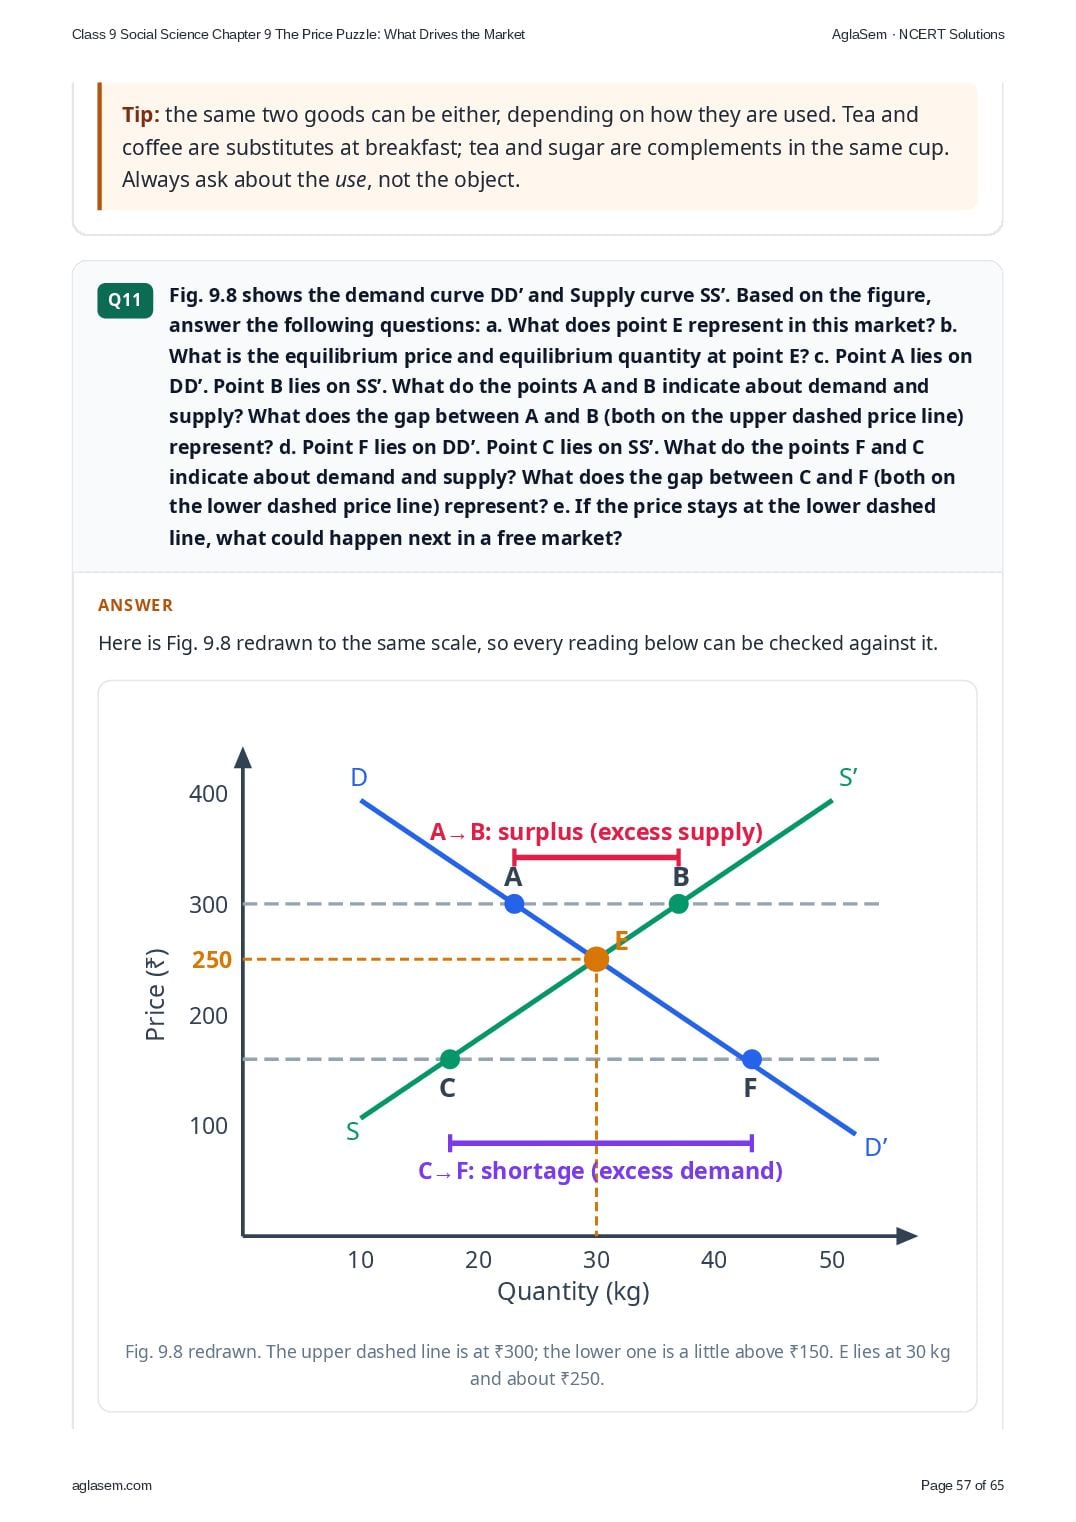
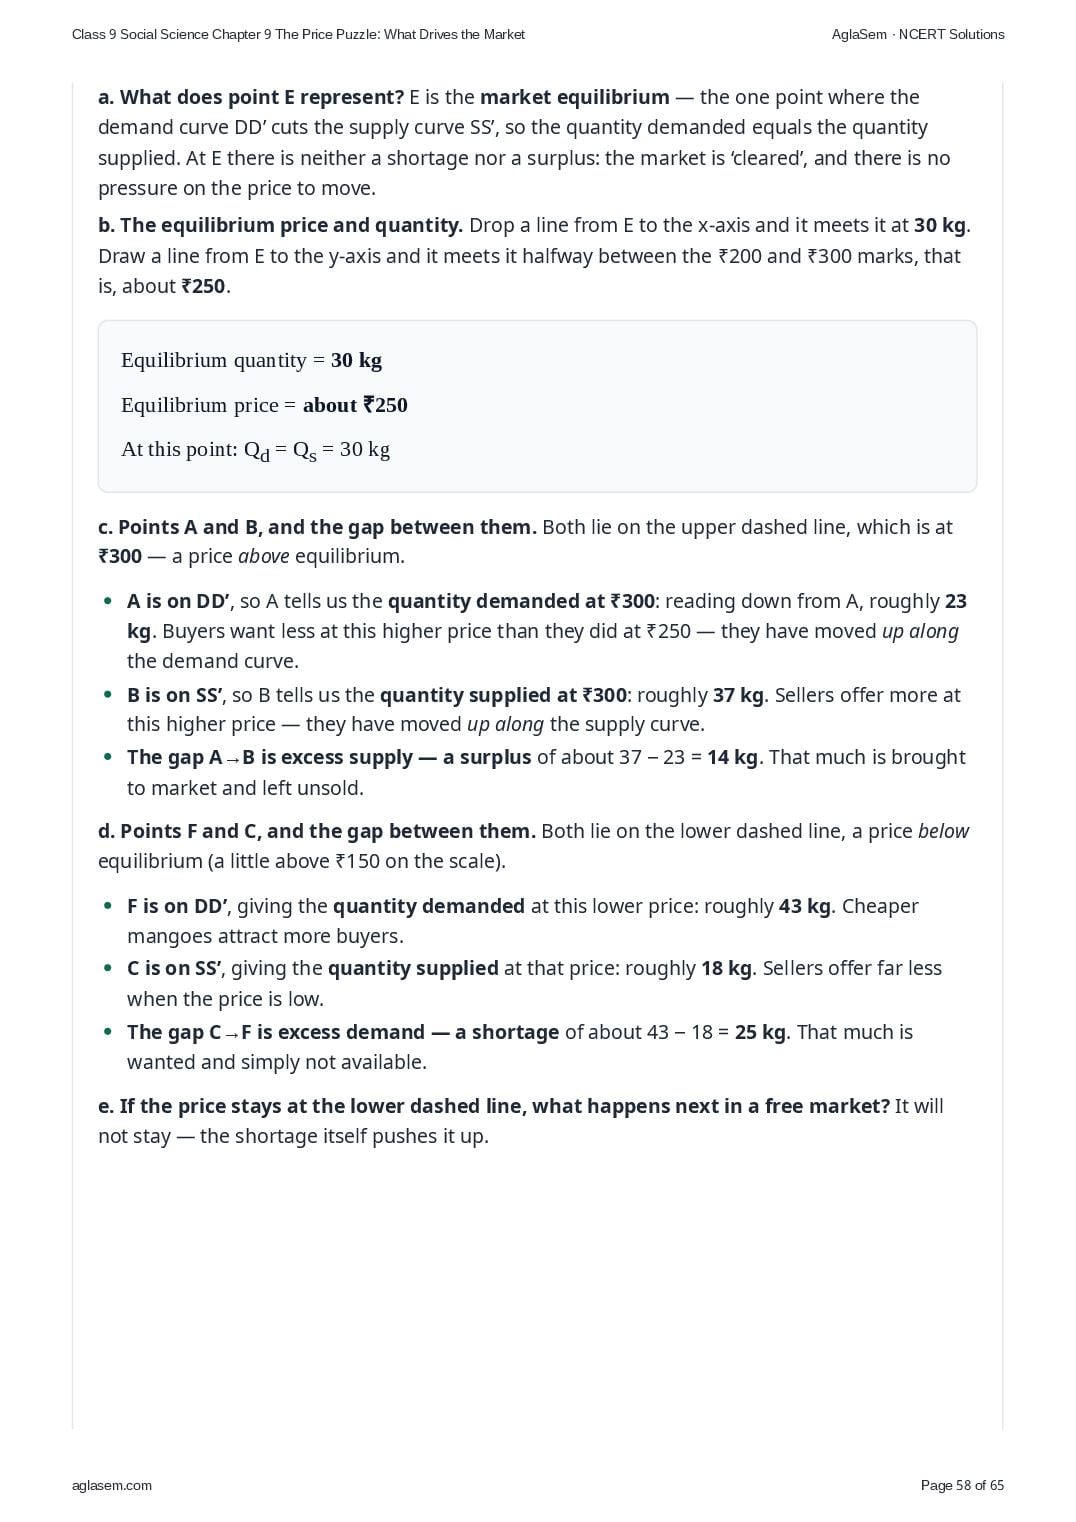
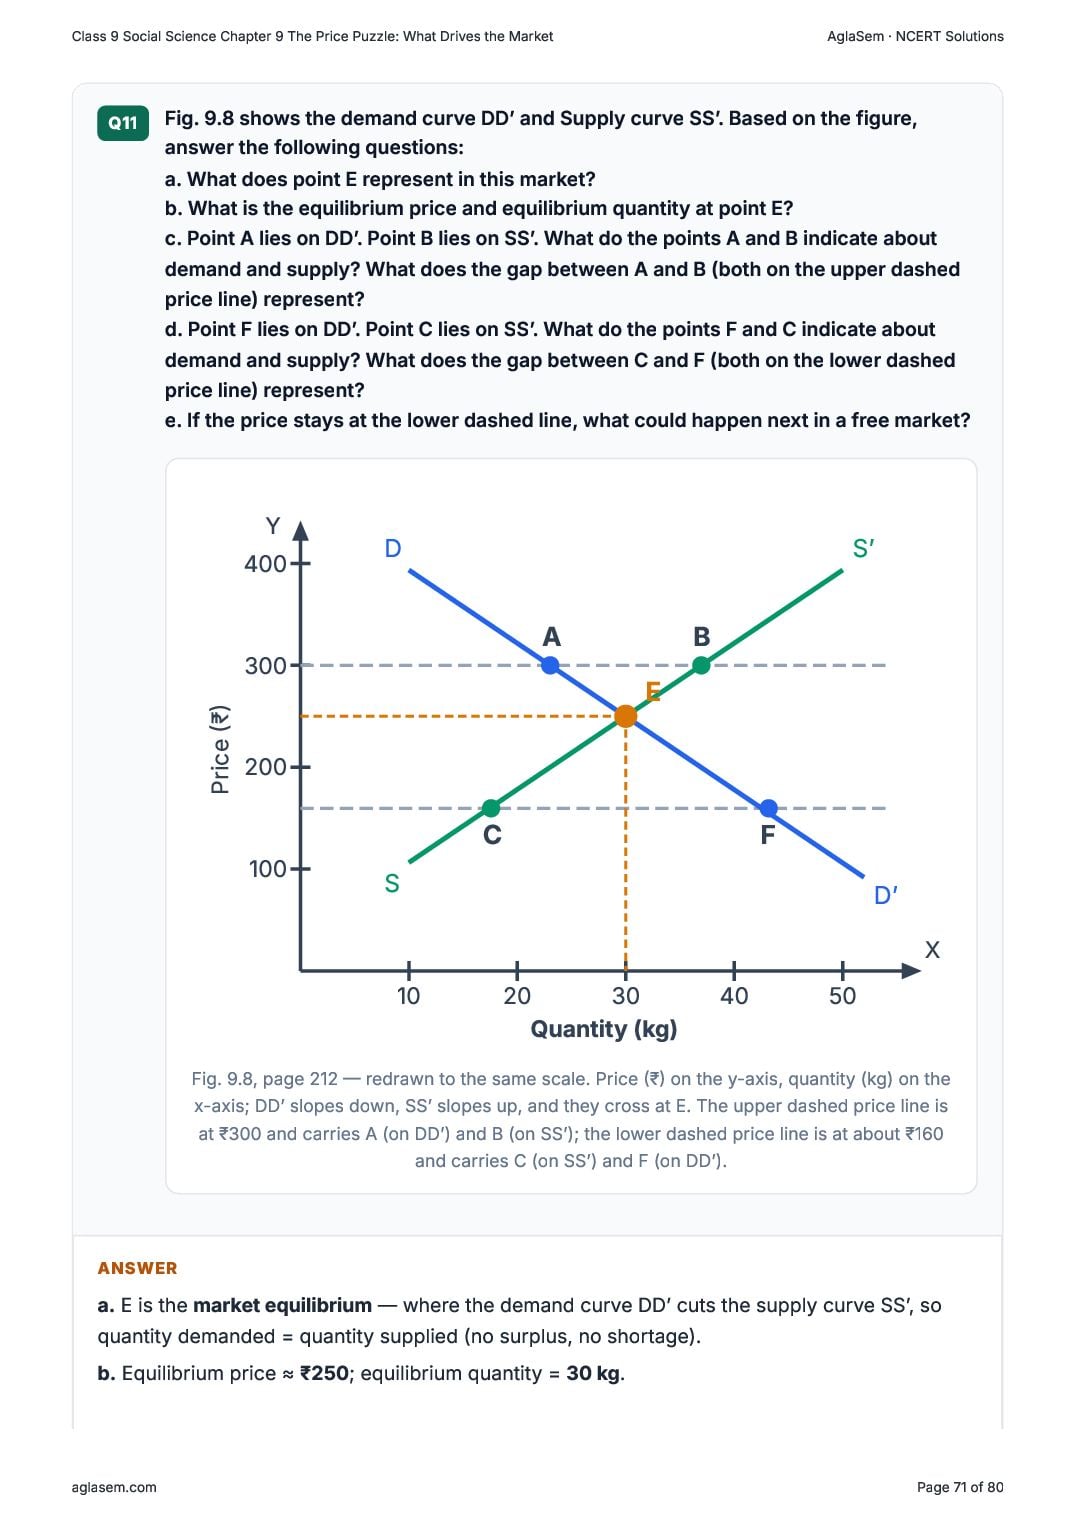
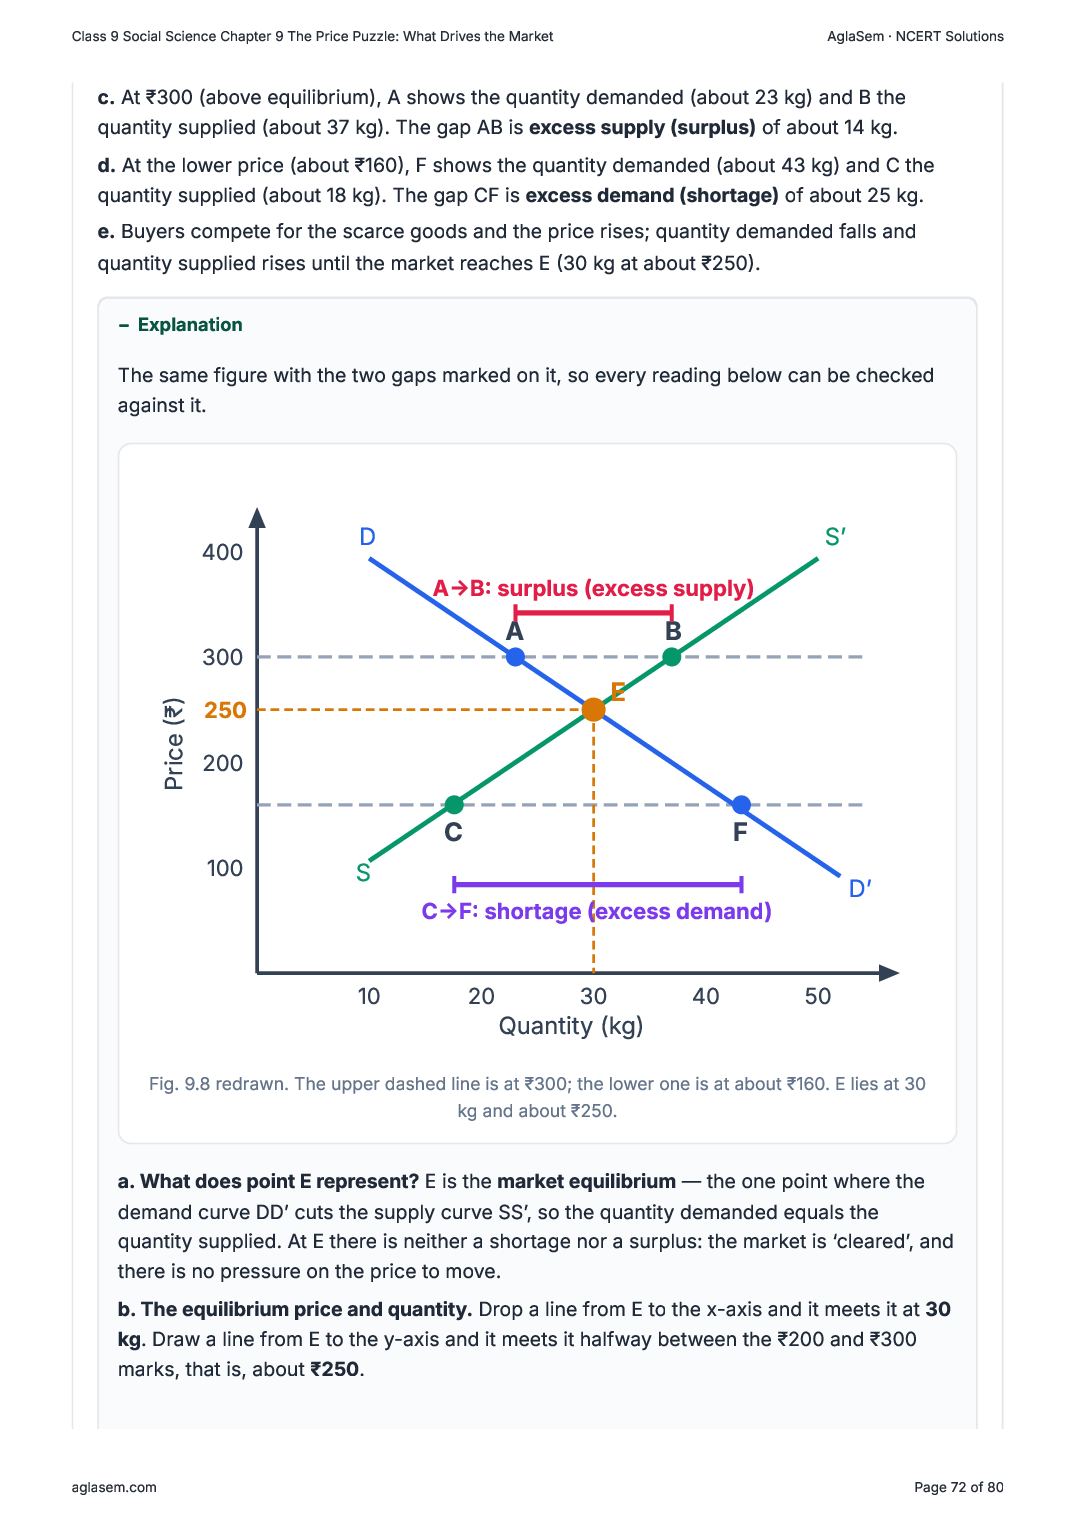
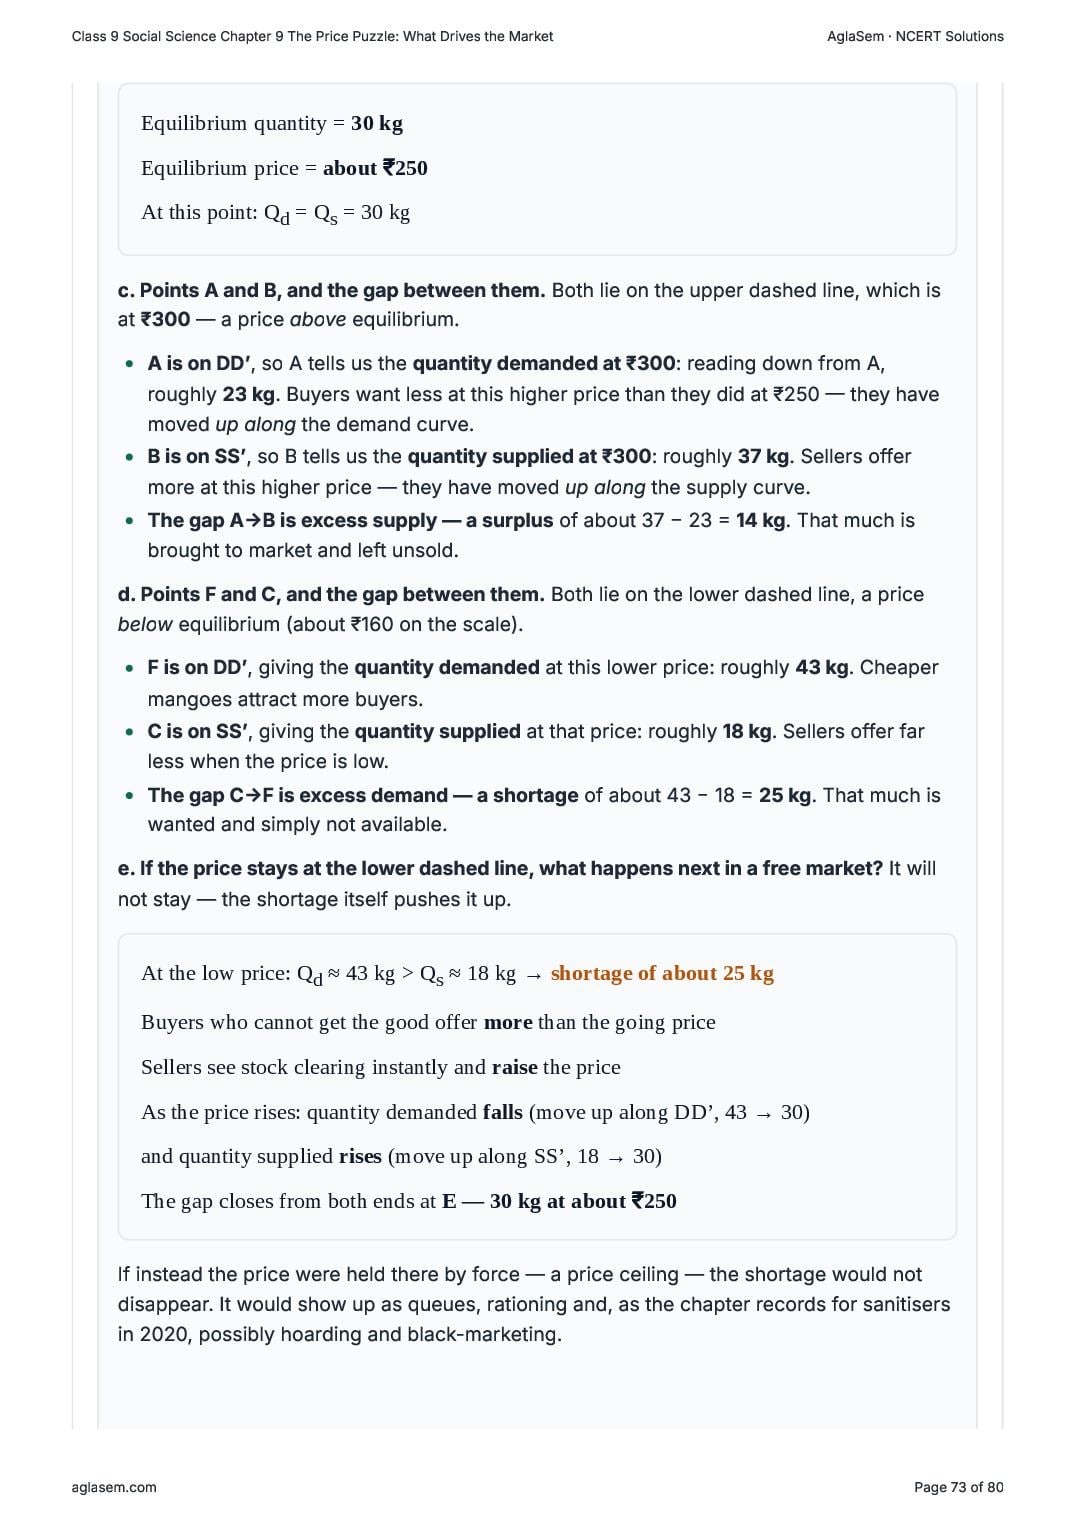
- Fig. 9.8 shows the demand curve DD’ and Supply curve SS’. Based on the figure, answer the following questions: a. What does point E represent in this market? b. What is the equilibrium price and equilibrium quantity at point E? c. Point A lies on DD’. Point B lies on SS’. What do the points A and B indicate about demand and supply? What does the gap between A and B (both on the upper dashed price line) represent? d. Point F lies on DD’. Point C lies on SS’. What do the points F and C indicate about demand and supply? What does the gap between C and F (both on the lower dashed price line) represent? e. If the price stays at the lower dashed line, what could happen next in a free market?
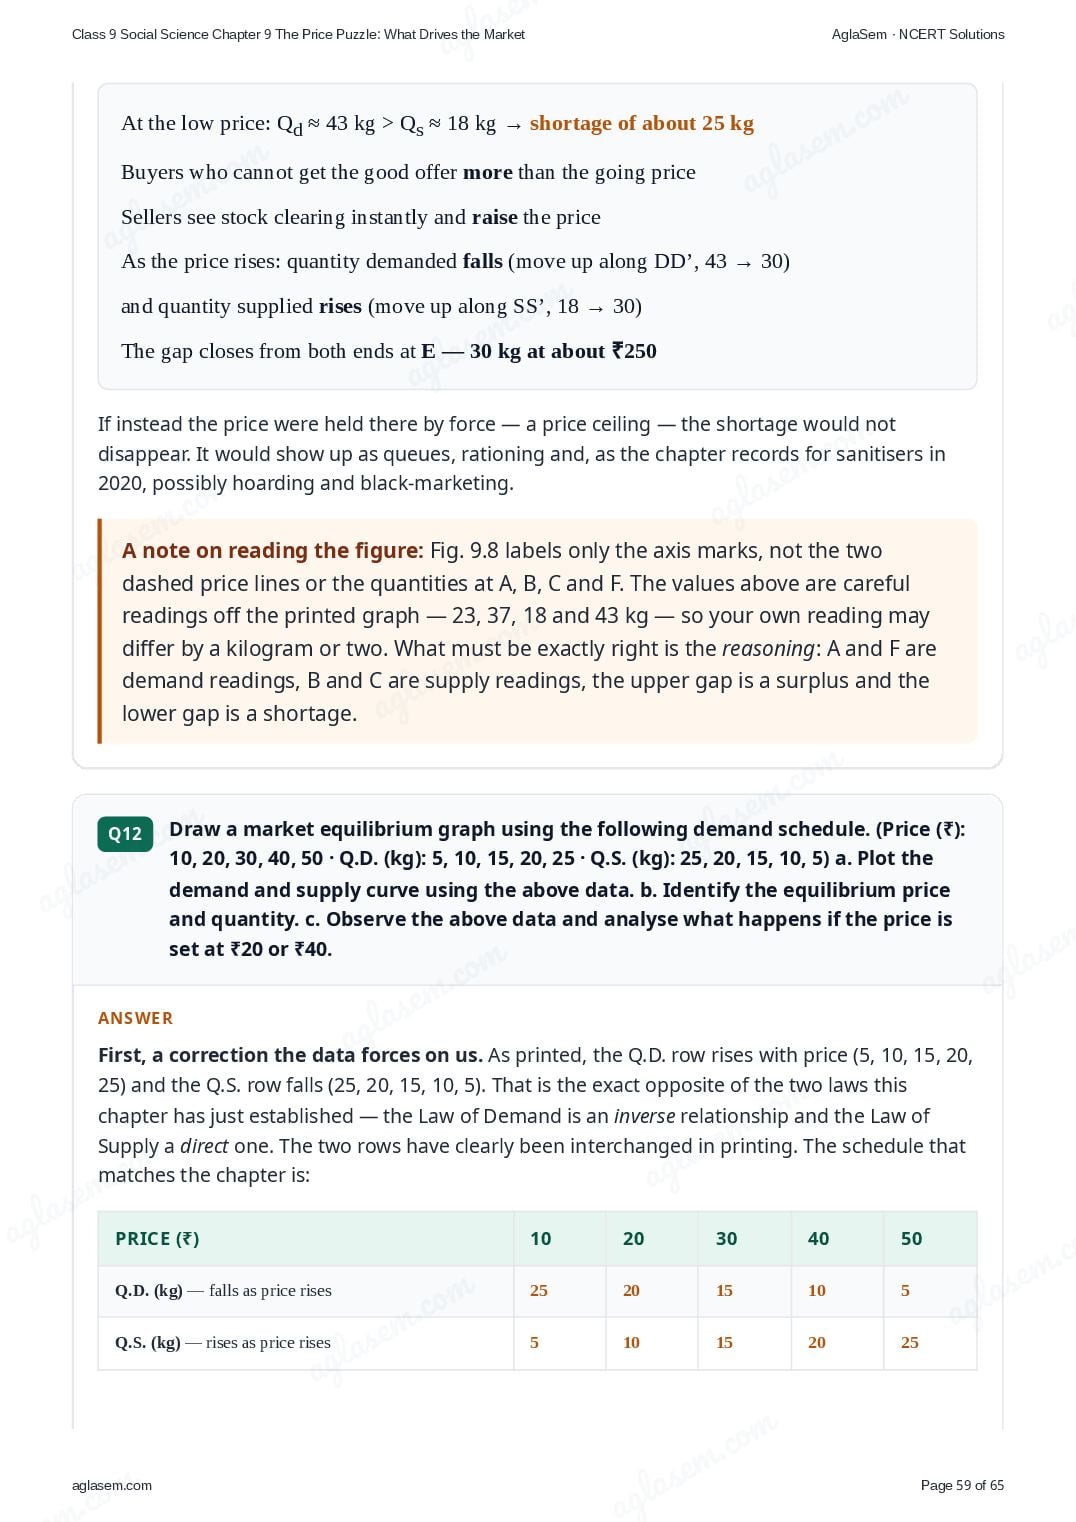
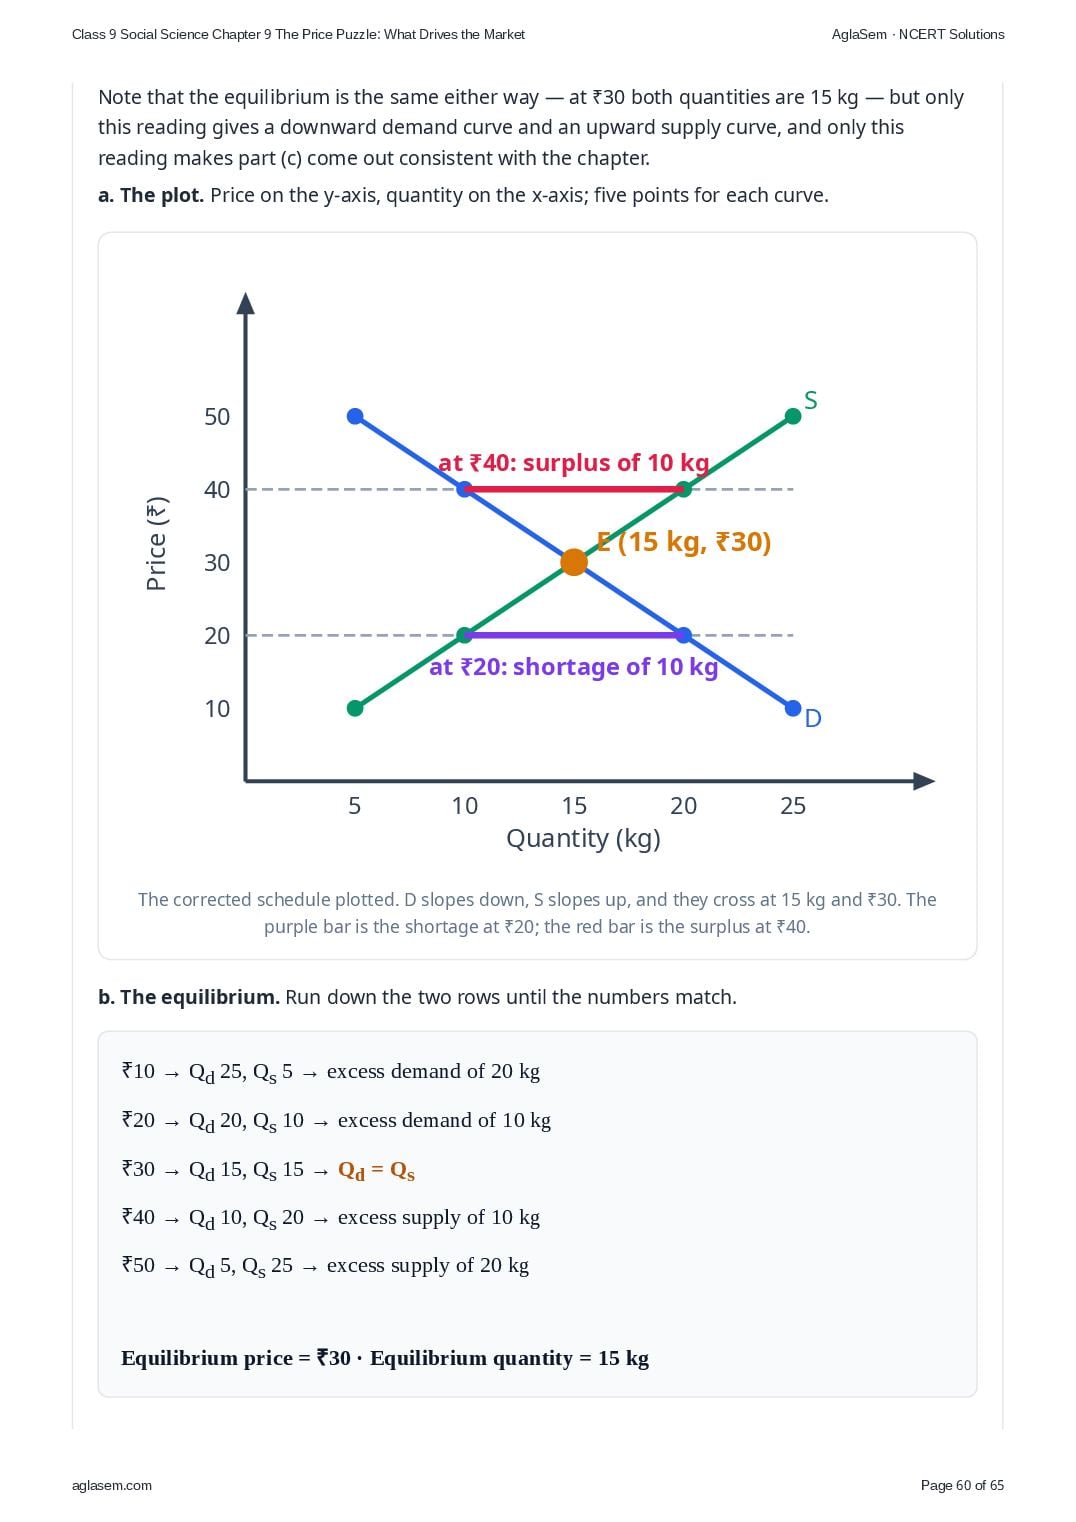
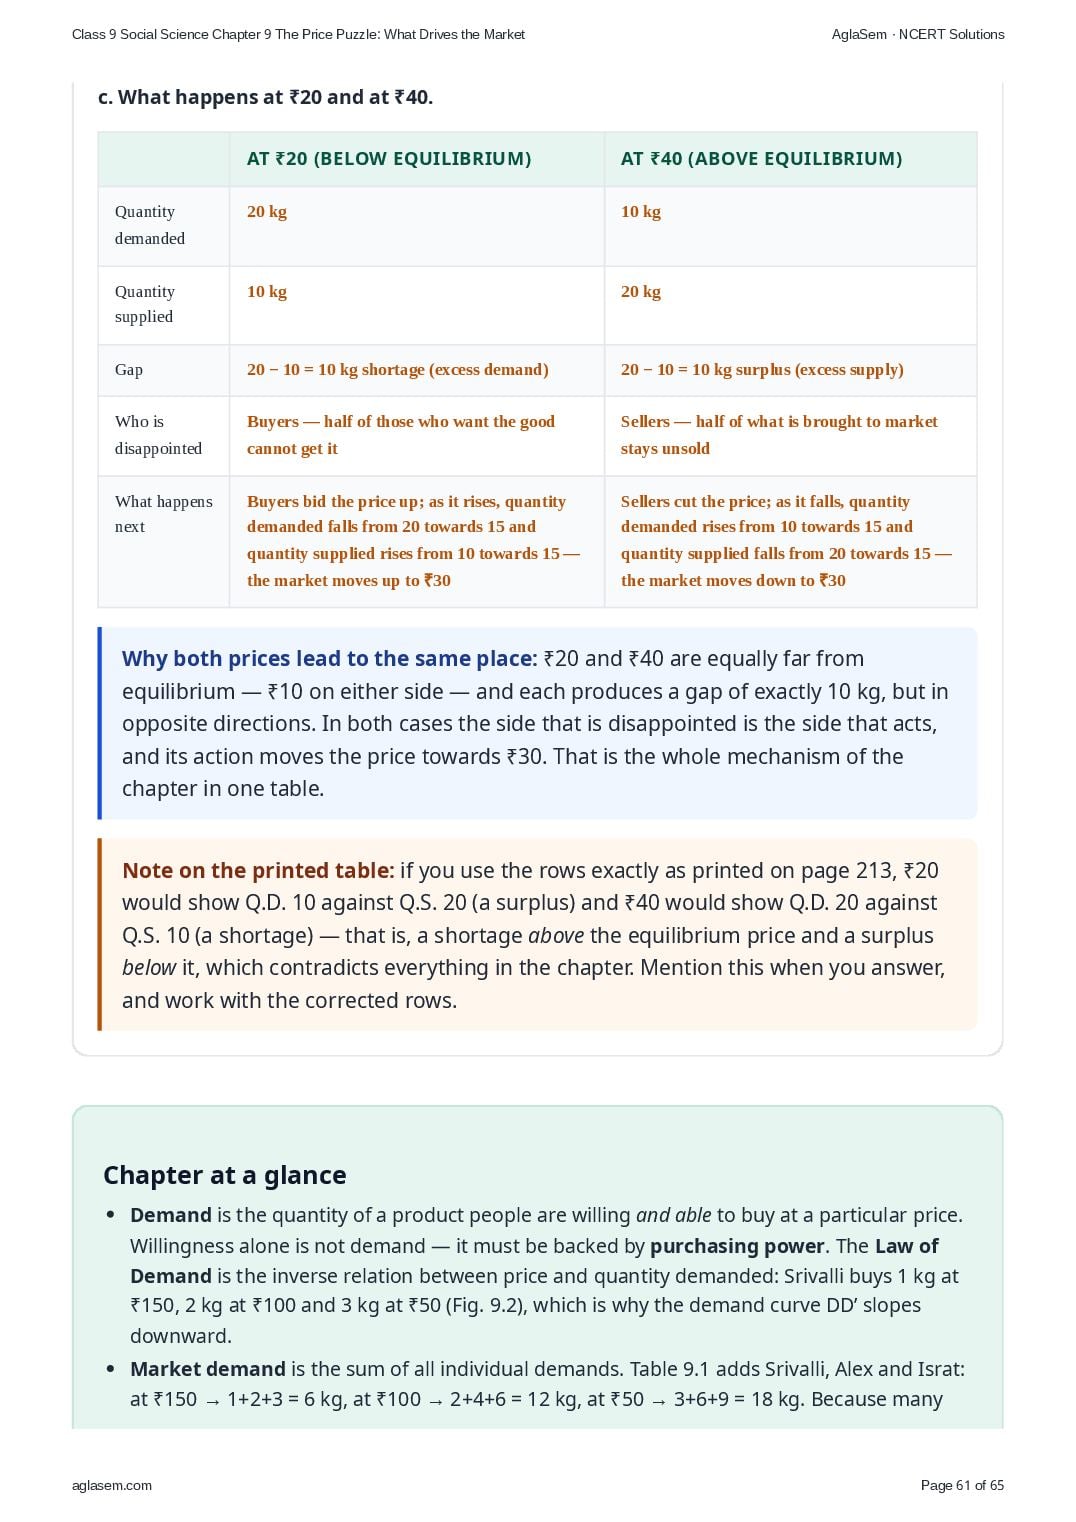
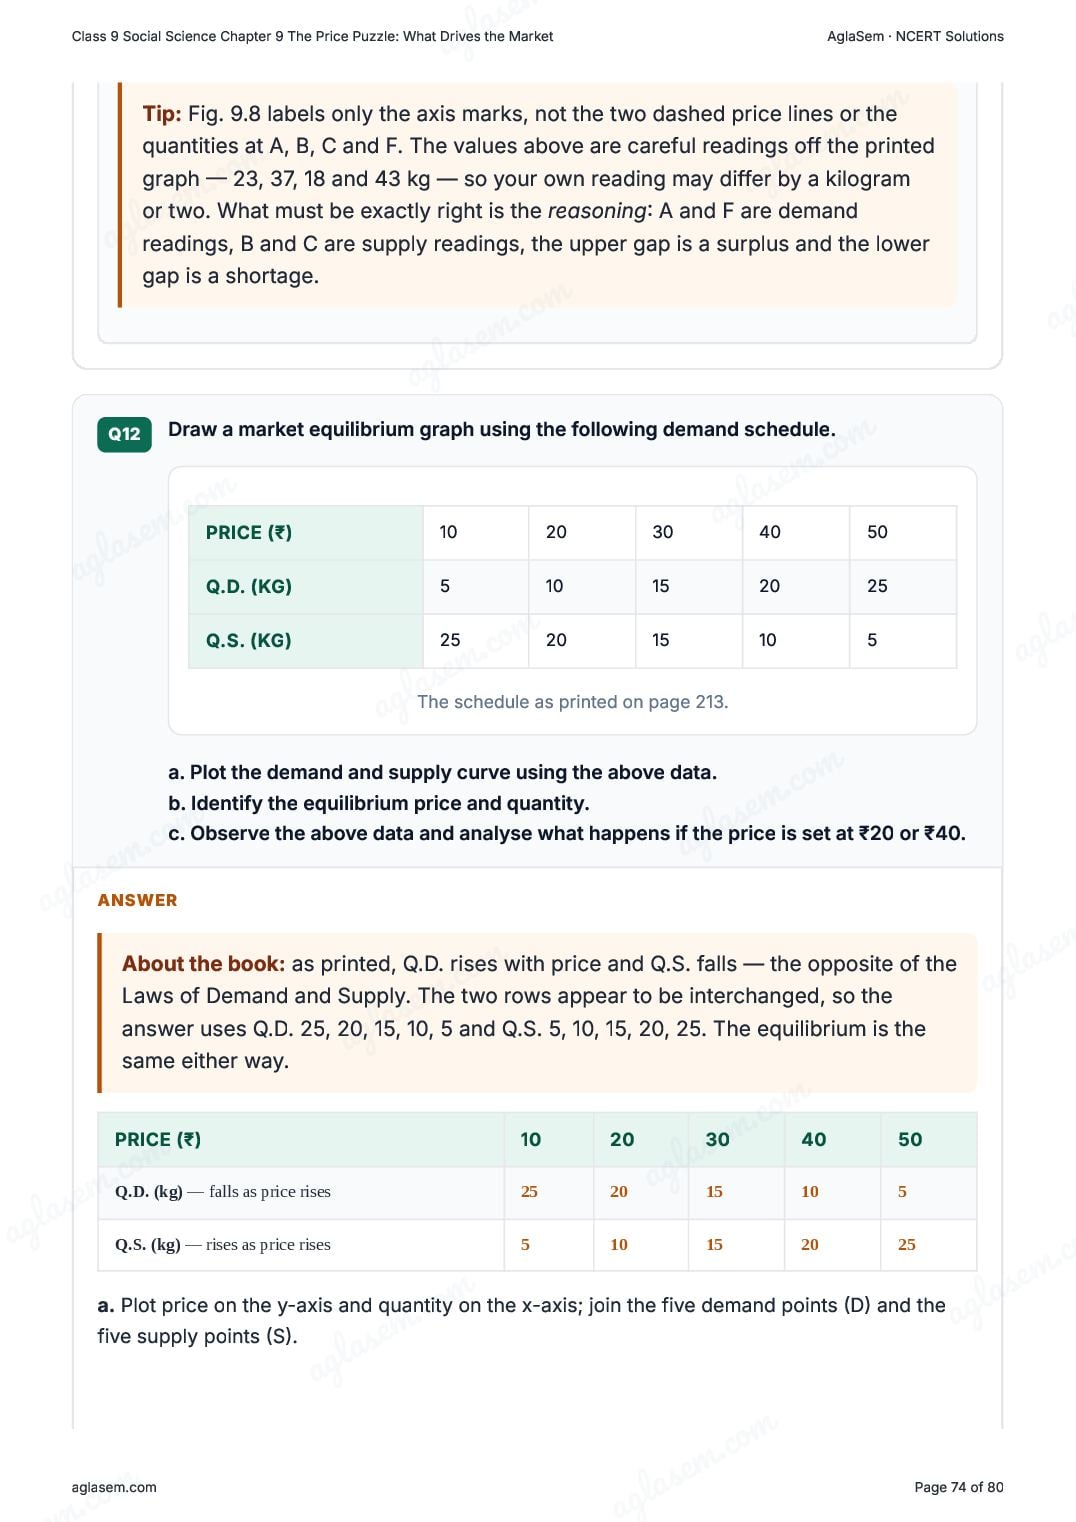
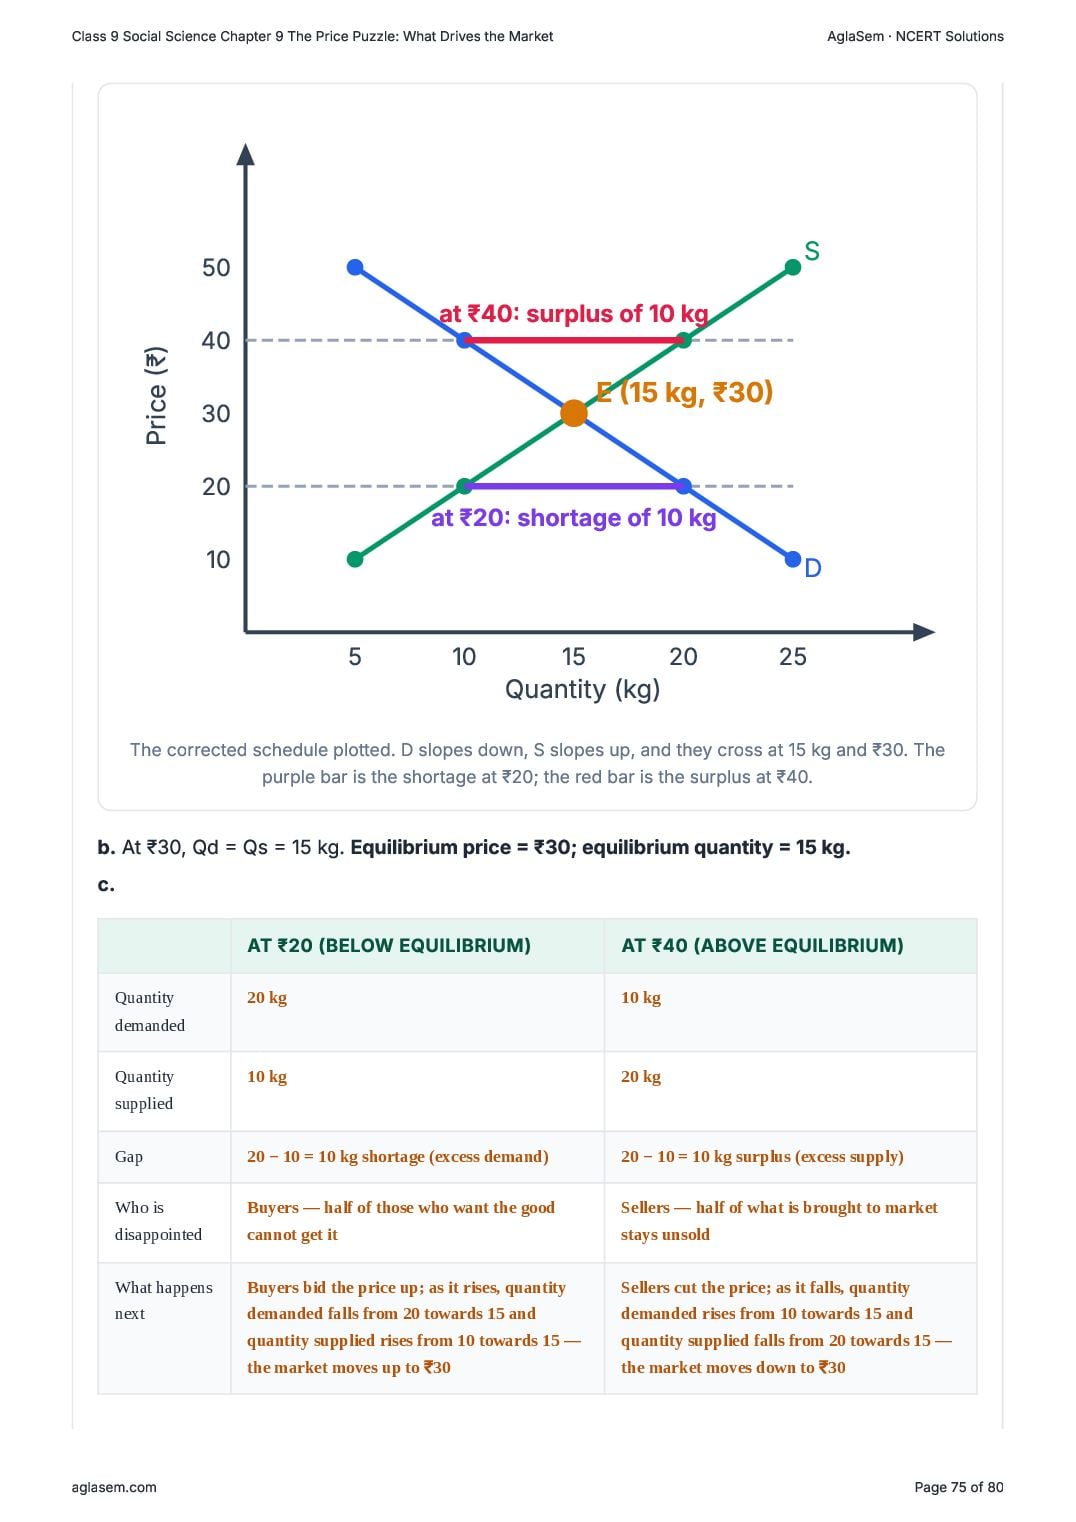
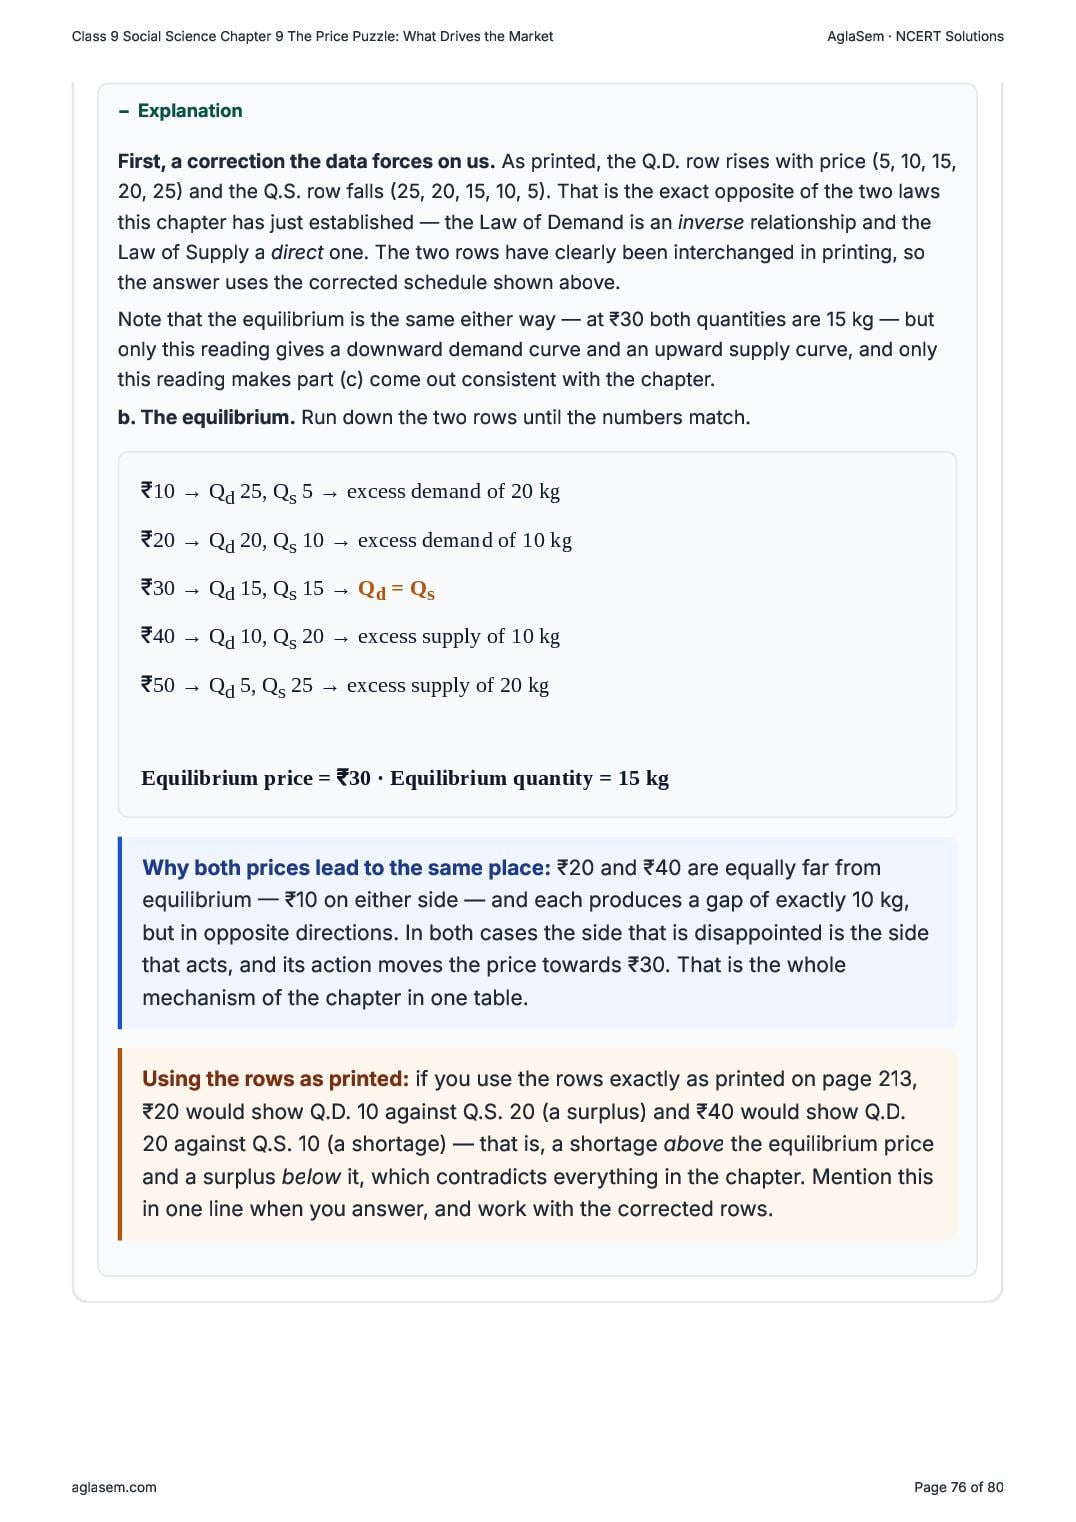
- Draw a market equilibrium graph using the following demand schedule. (Price (₹): 10, 20, 30, 40, 50 · Q.D. (kg): 5, 10, 15, 20, 25 · Q.S. (kg): 25, 20, 15, 10, 5) a. Plot the demand and supply curve using the above data. b. Identify the equilibrium price and quantity. c. Observe the above data and analyse what happens if the price is set at ₹20 or ₹40.
Chapter at a Glance
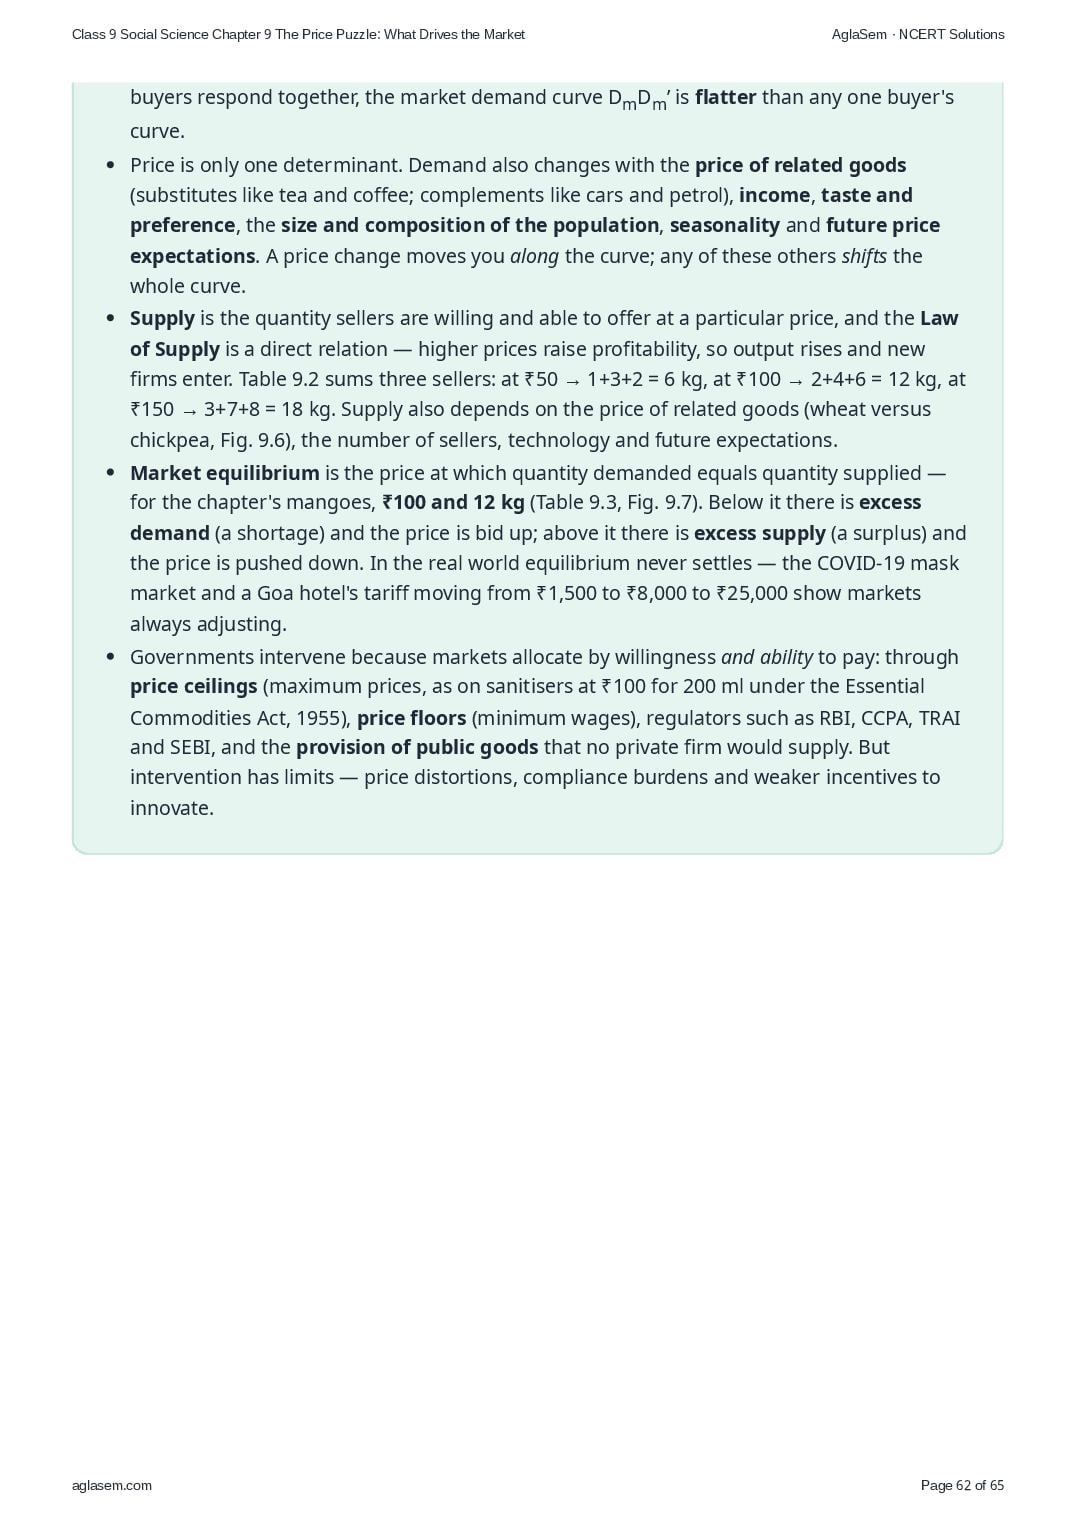
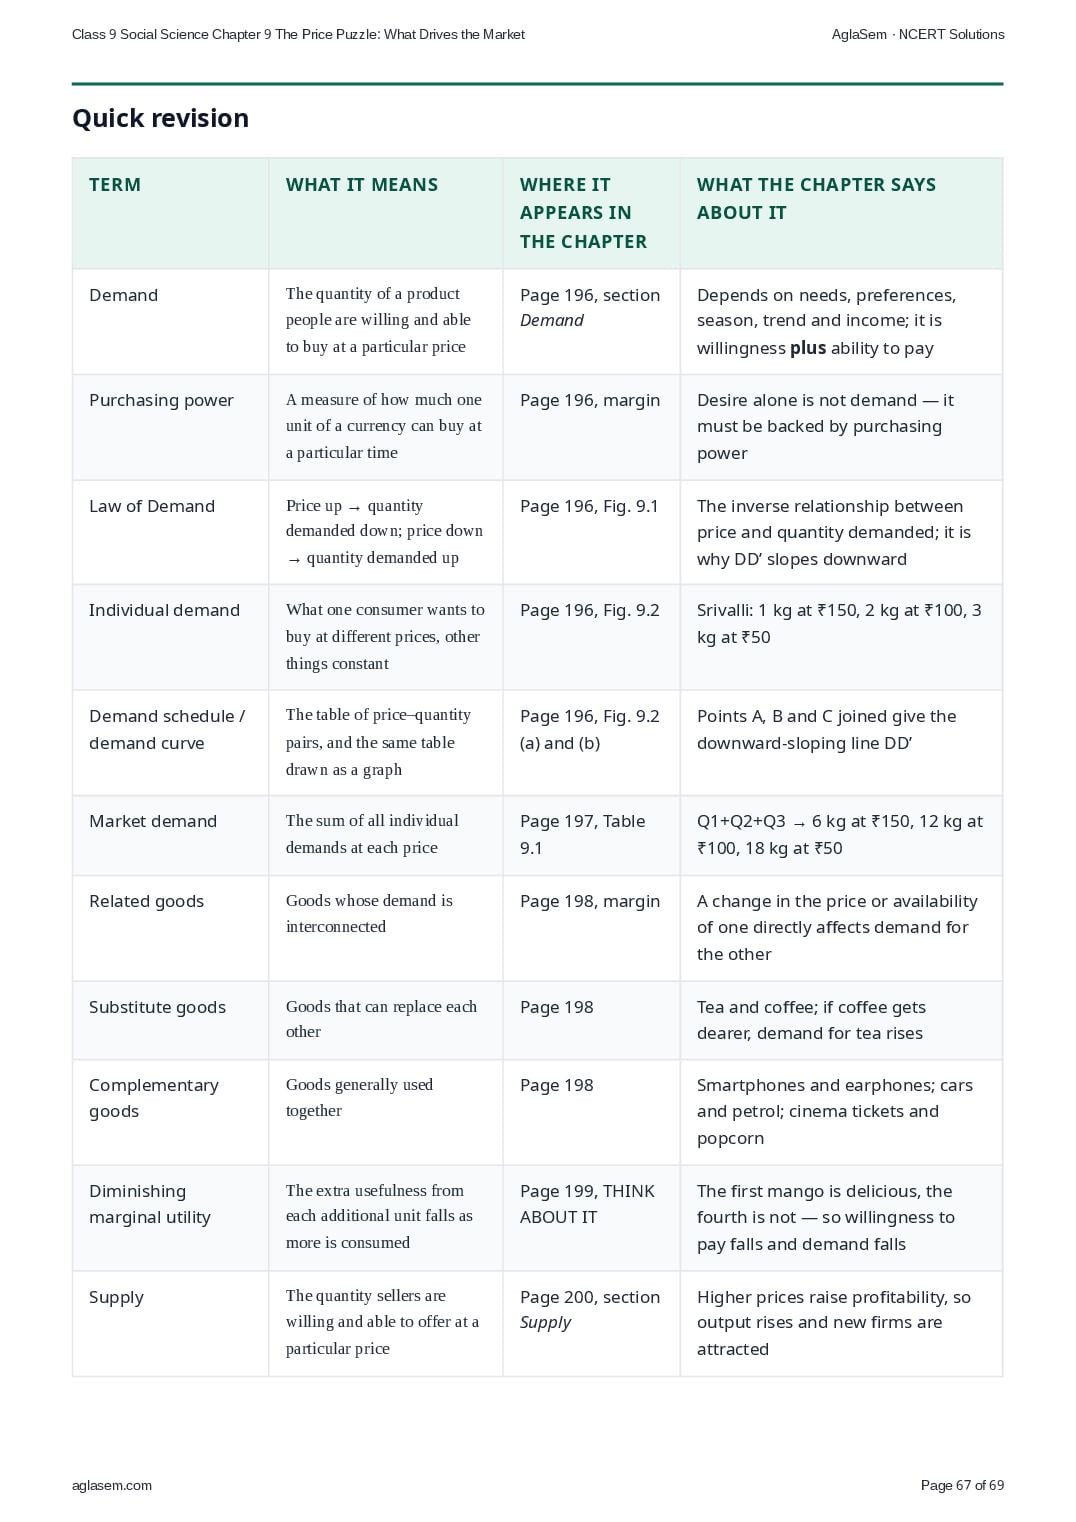
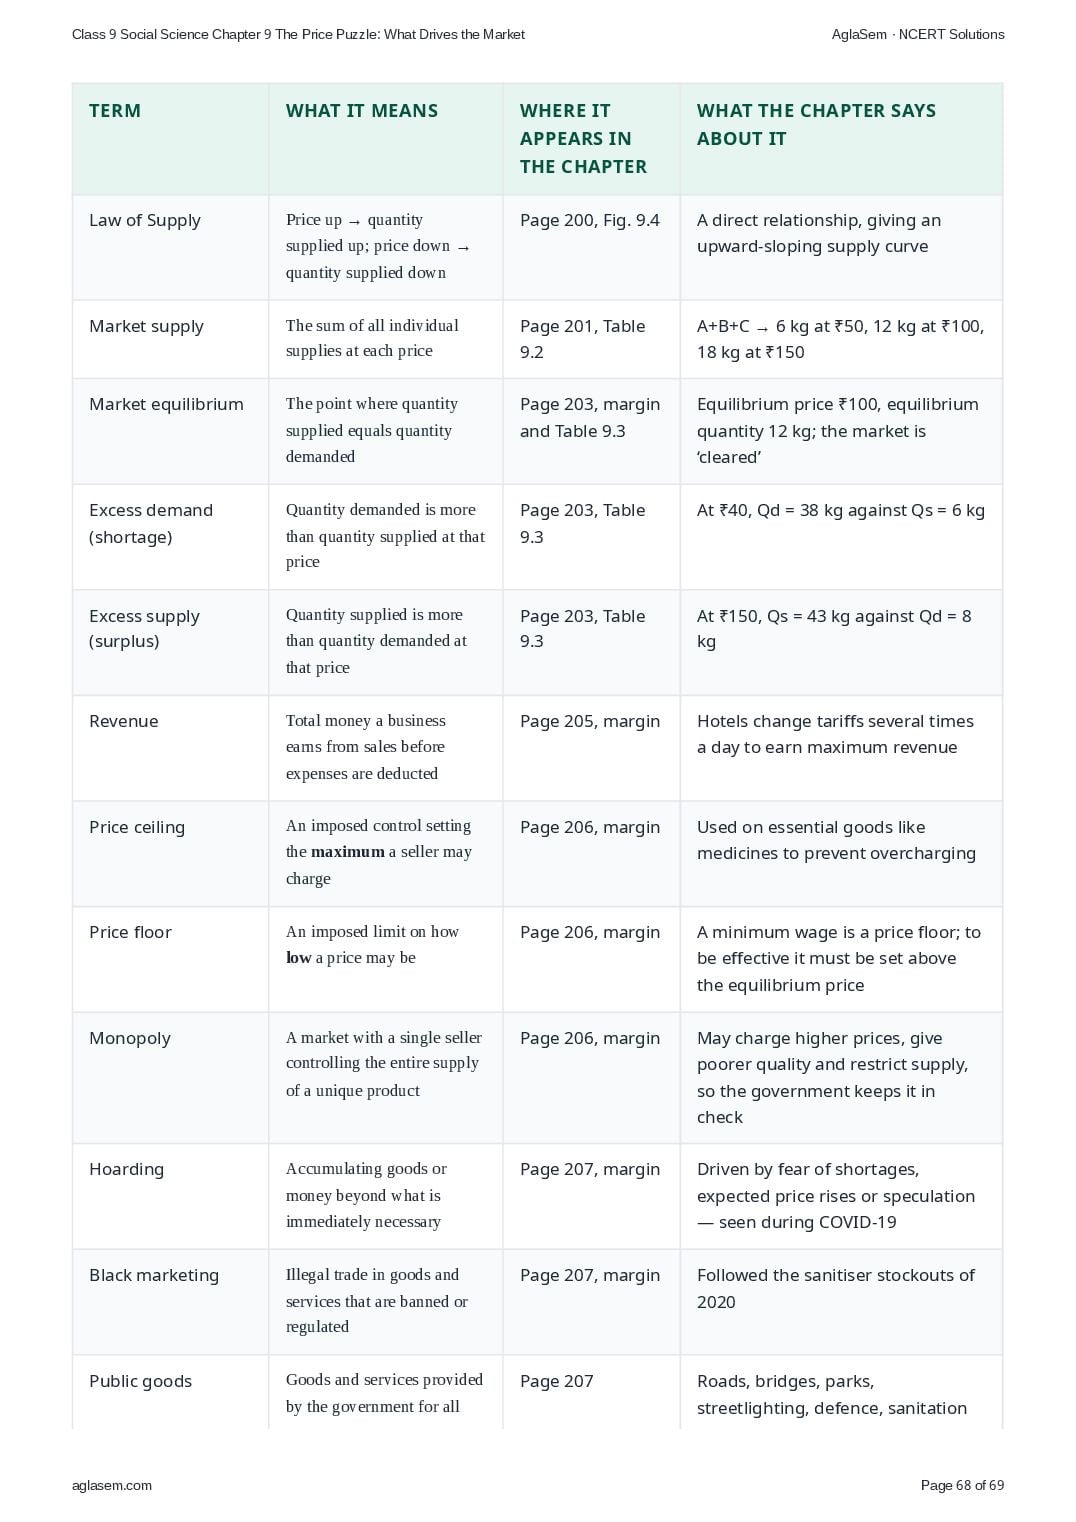
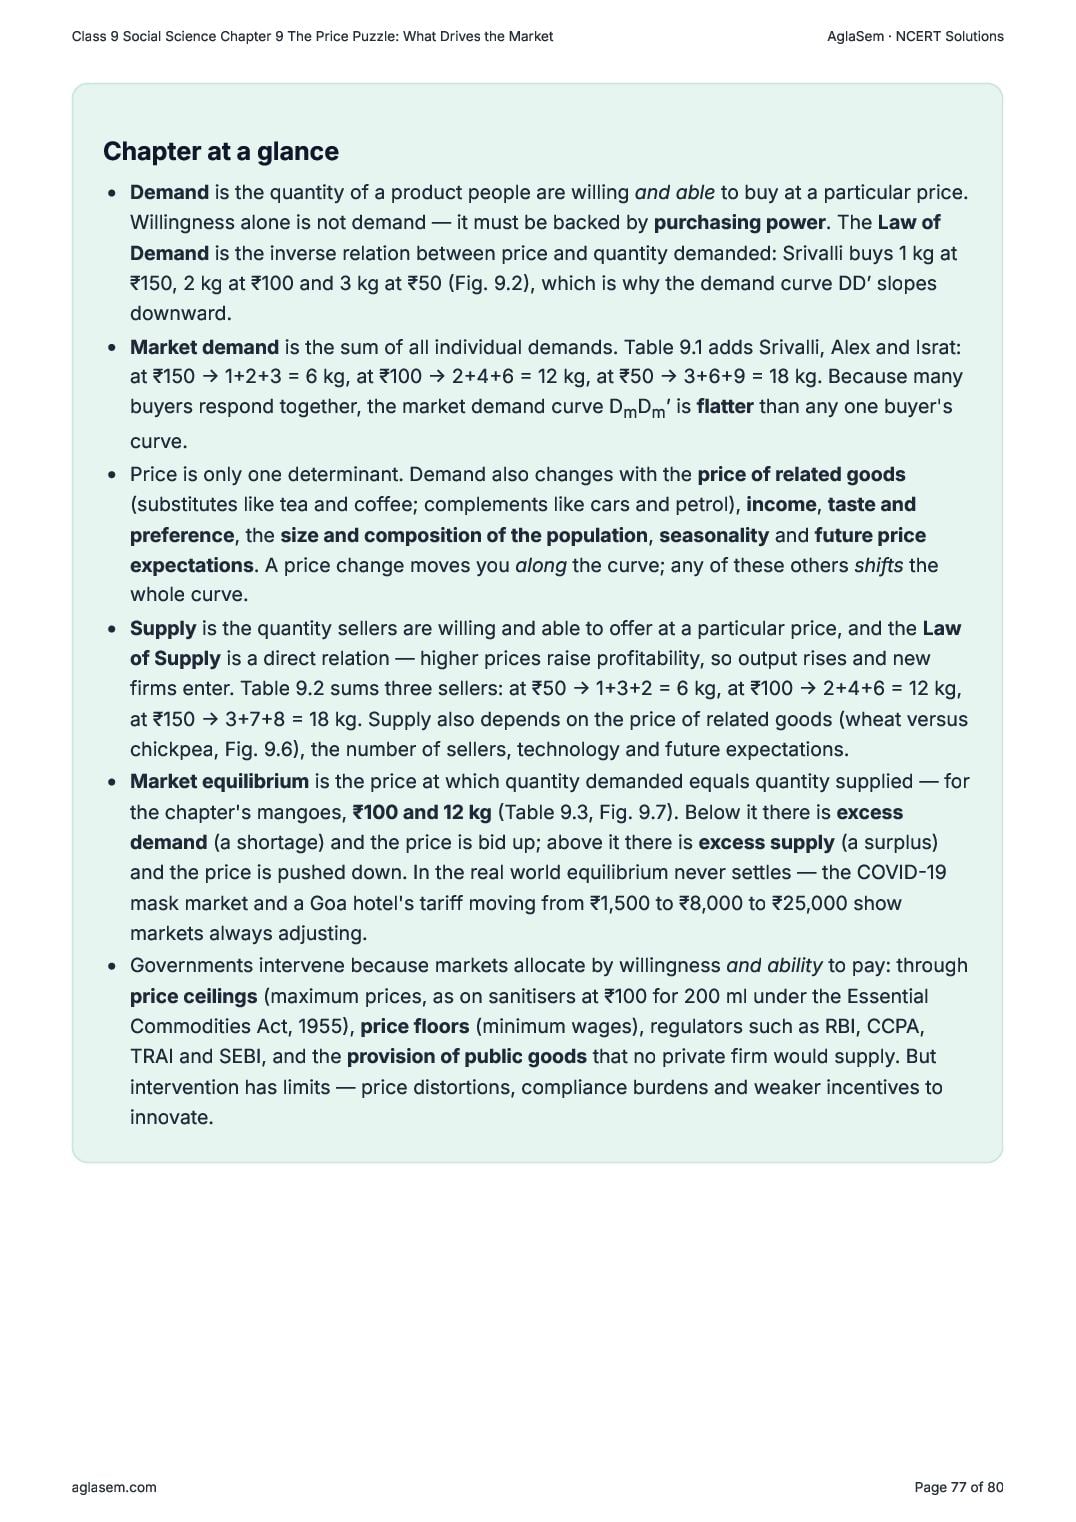
- Demand is the quantity of a product people are willing and able to buy at a particular price. Willingness alone is not demand — it must be backed by purchasing power . The Law of Demand is the inverse relation between price and quantity demanded: Srivalli buys 1 kg at ₹150, 2 kg at ₹100 and 3 kg at ₹50 (Fig. 9.2), which is why the demand curve DD’ slopes downward.
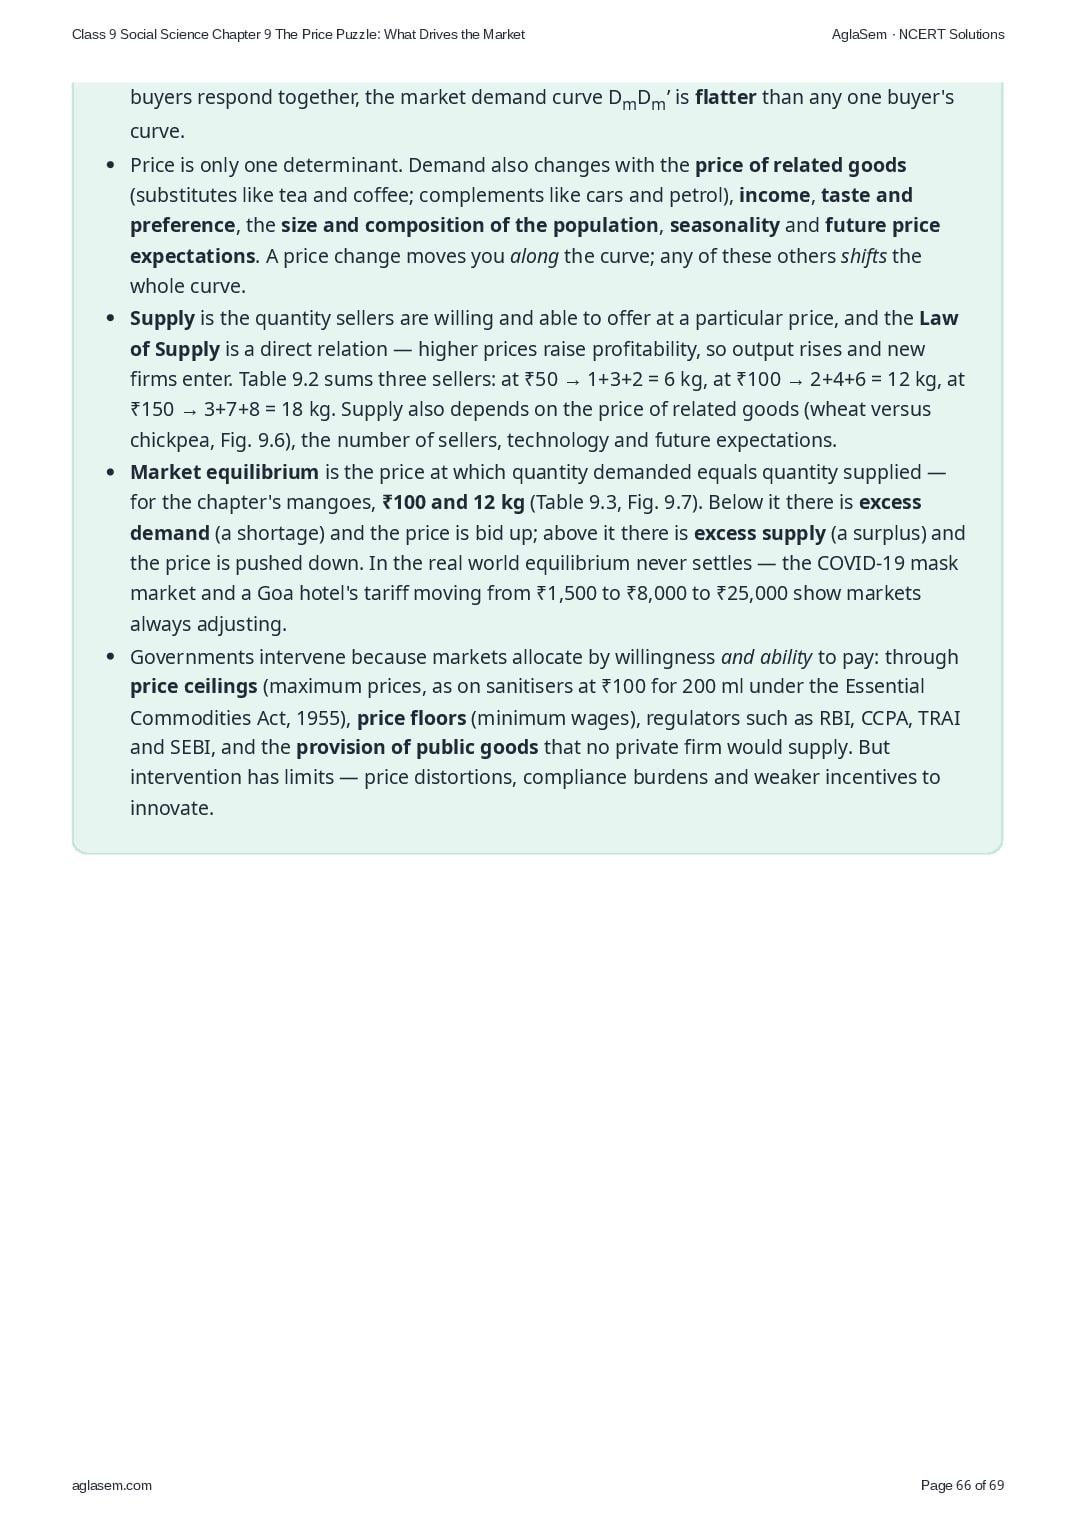
- Market demand is the sum of all individual demands. Table 9.1 adds Srivalli, Alex and Israt: at ₹150 → 1+2+3 = 6 kg, at ₹100 → 2+4+6 = 12 kg, at ₹50 → 3+6+9 = 18 kg. Because many buyers respond together, the market demand curve D m D m ’ is flatter than any one buyer's curve.
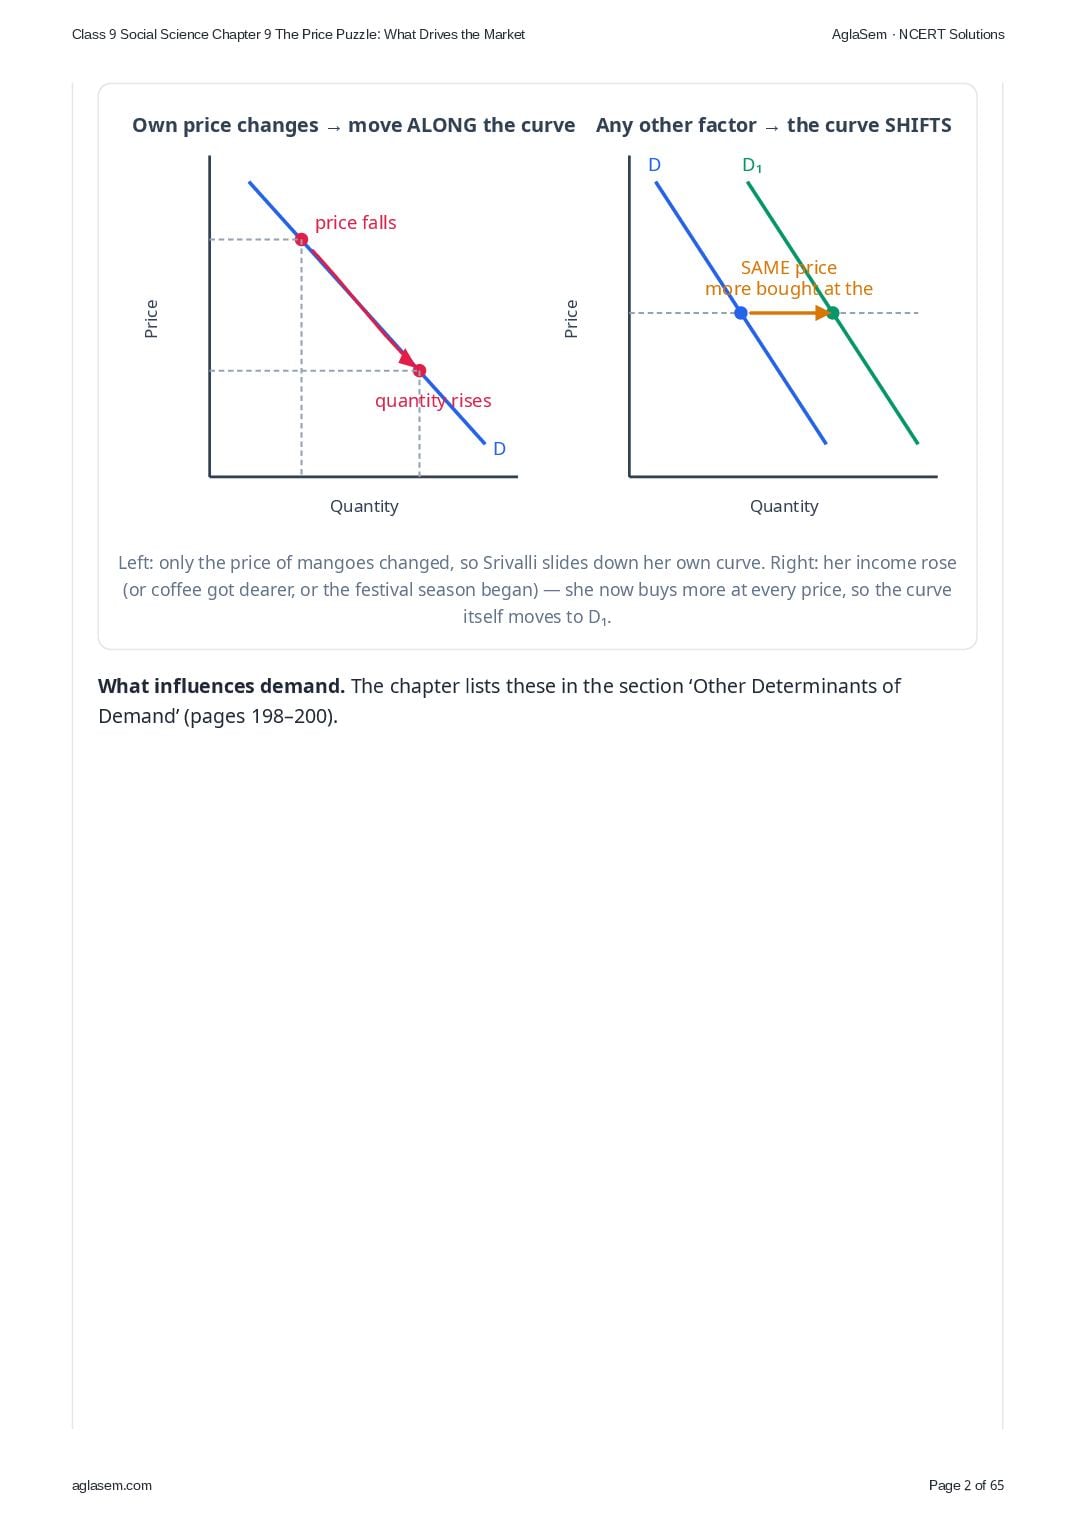
- Price is only one determinant. Demand also changes with the price of related goods (substitutes like tea and coffee; complements like cars and petrol), income , taste and preference , the size and composition of the population , seasonality and future price expectations . A price change moves you along the curve; any of these others shifts the whole curve.
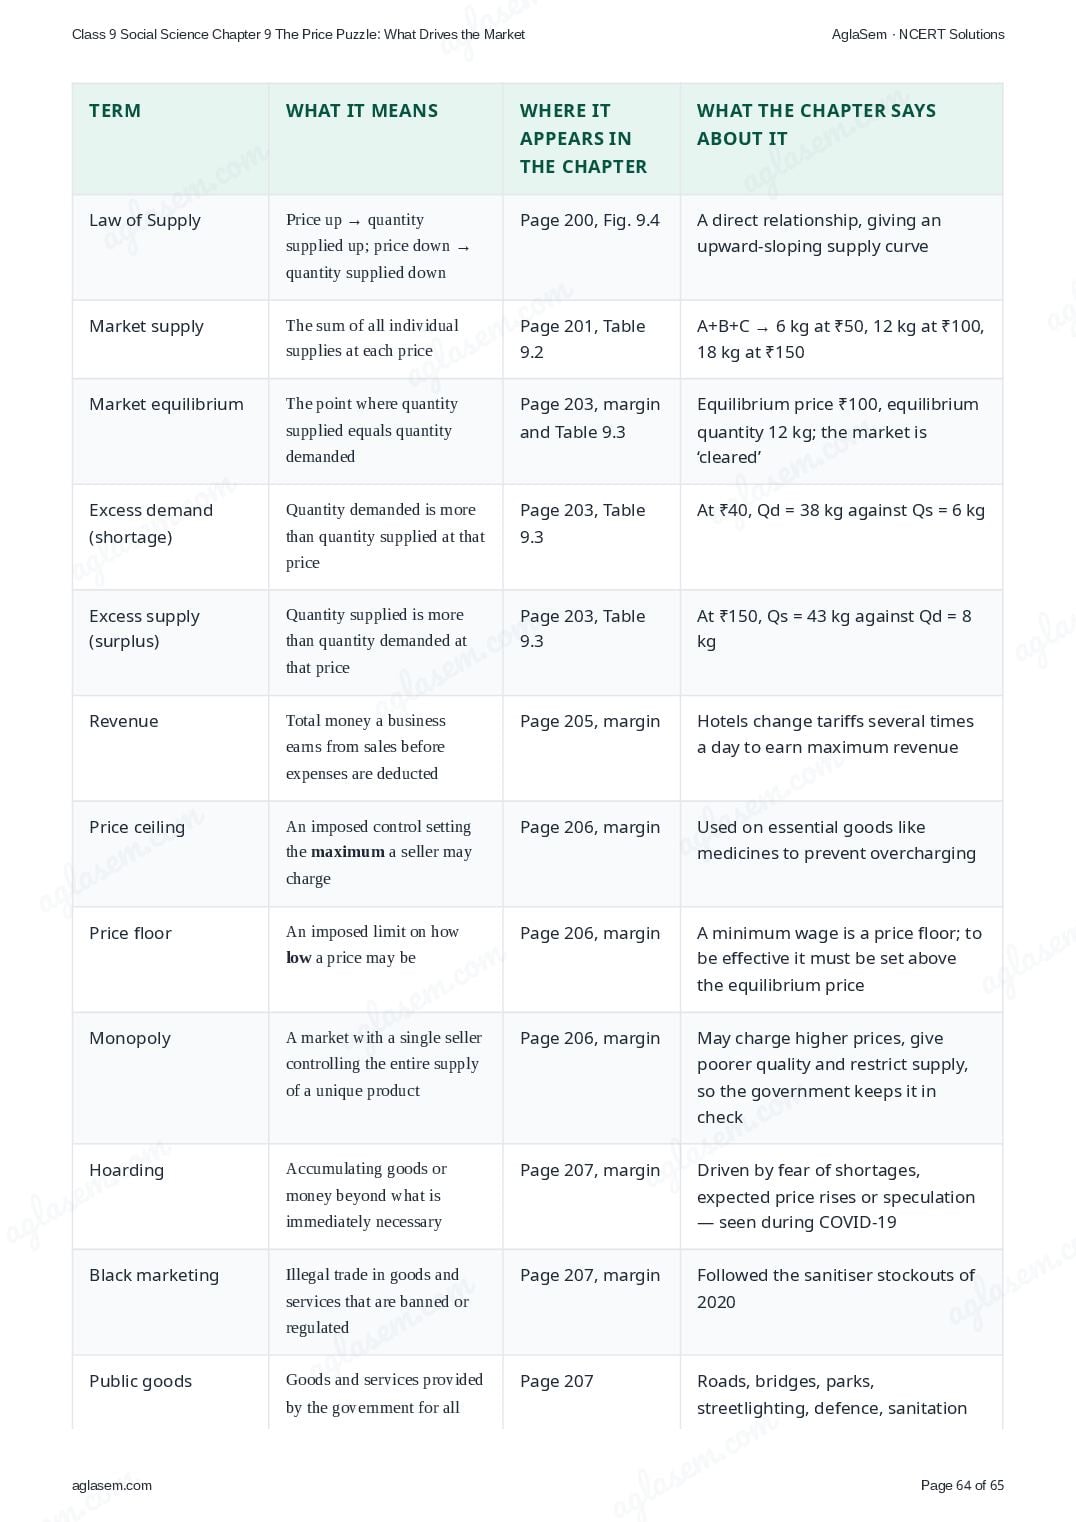
- Supply is the quantity sellers are willing and able to offer at a particular price, and the Law of Supply is a direct relation — higher prices raise profitability, so output rises and new firms enter. Table 9.2 sums three sellers: at ₹50 → 1+3+2 = 6 kg, at ₹100 → 2+4+6 = 12 kg, at ₹150 → 3+7+8 = 18 kg. Supply also depends on the price of related goods (wheat versus chickpea, Fig. 9.6), the number of sellers, technology and future expectations.
- Market equilibrium is the price at which quantity demanded equals quantity supplied — for the chapter's mangoes, ₹100 and 12 kg (Table 9.3, Fig. 9.7). Below it there is excess demand (a shortage) and the price is bid up; above it there is excess supply (a surplus) and the price is pushed down. In the real world equilibrium never settles — the COVID-19 mask market and a Goa hotel's tariff moving from ₹1,500 to ₹8,000 to ₹25,000 show markets always adjusting.
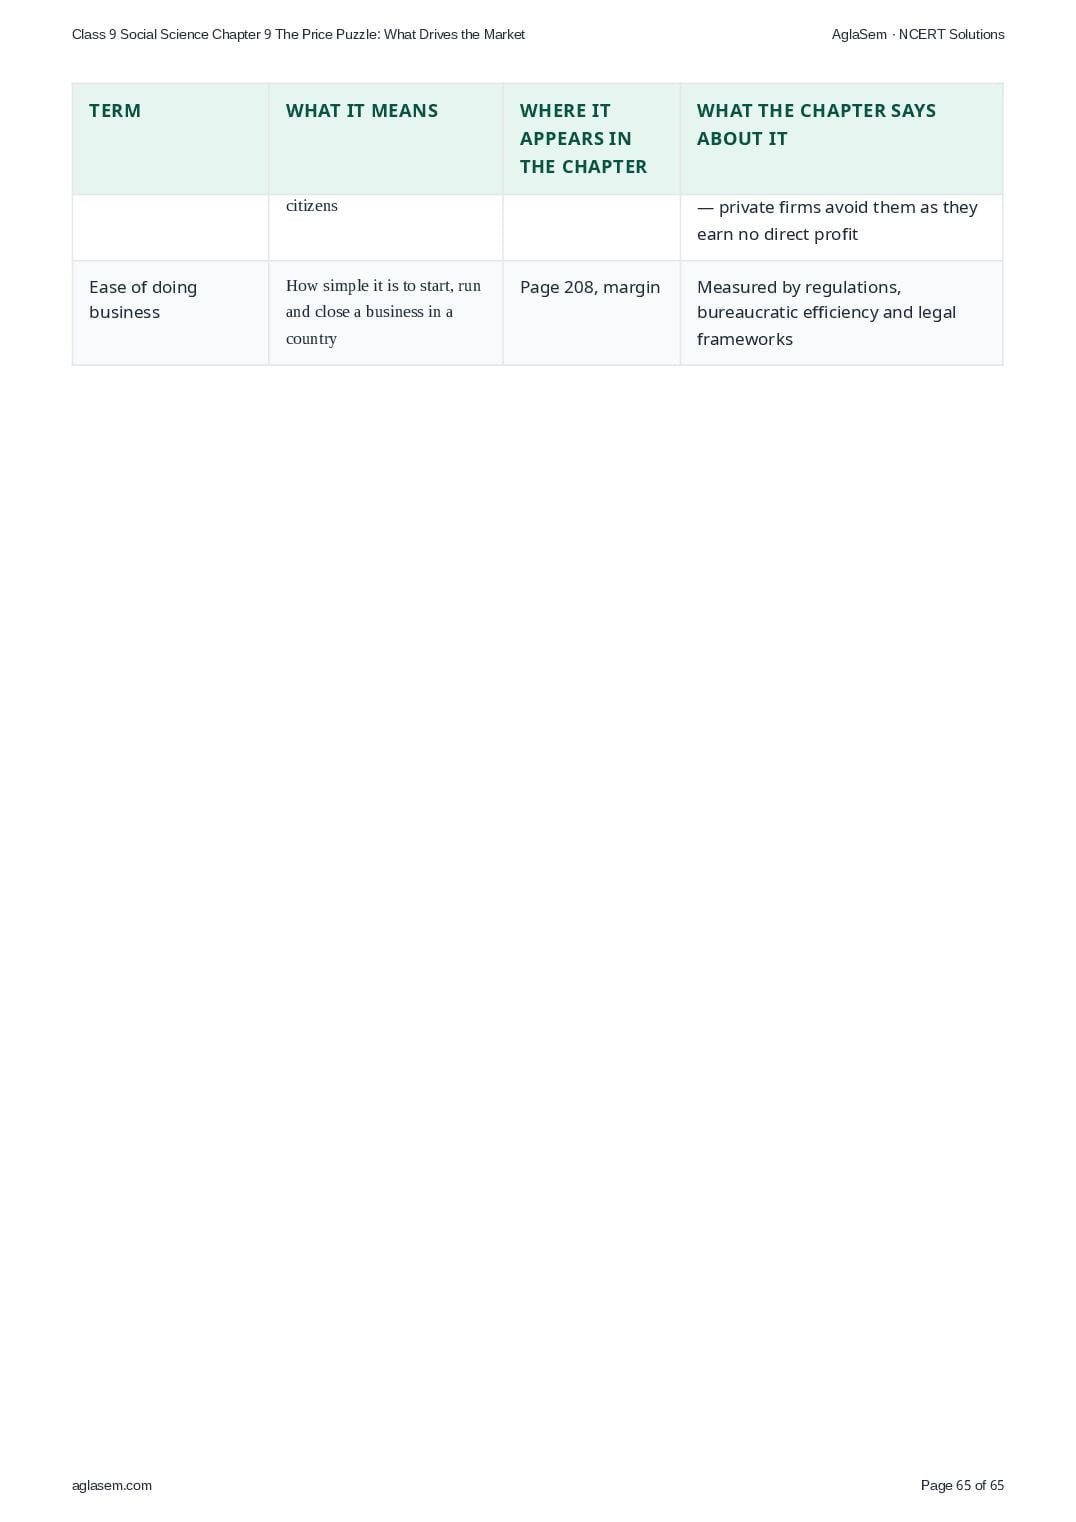
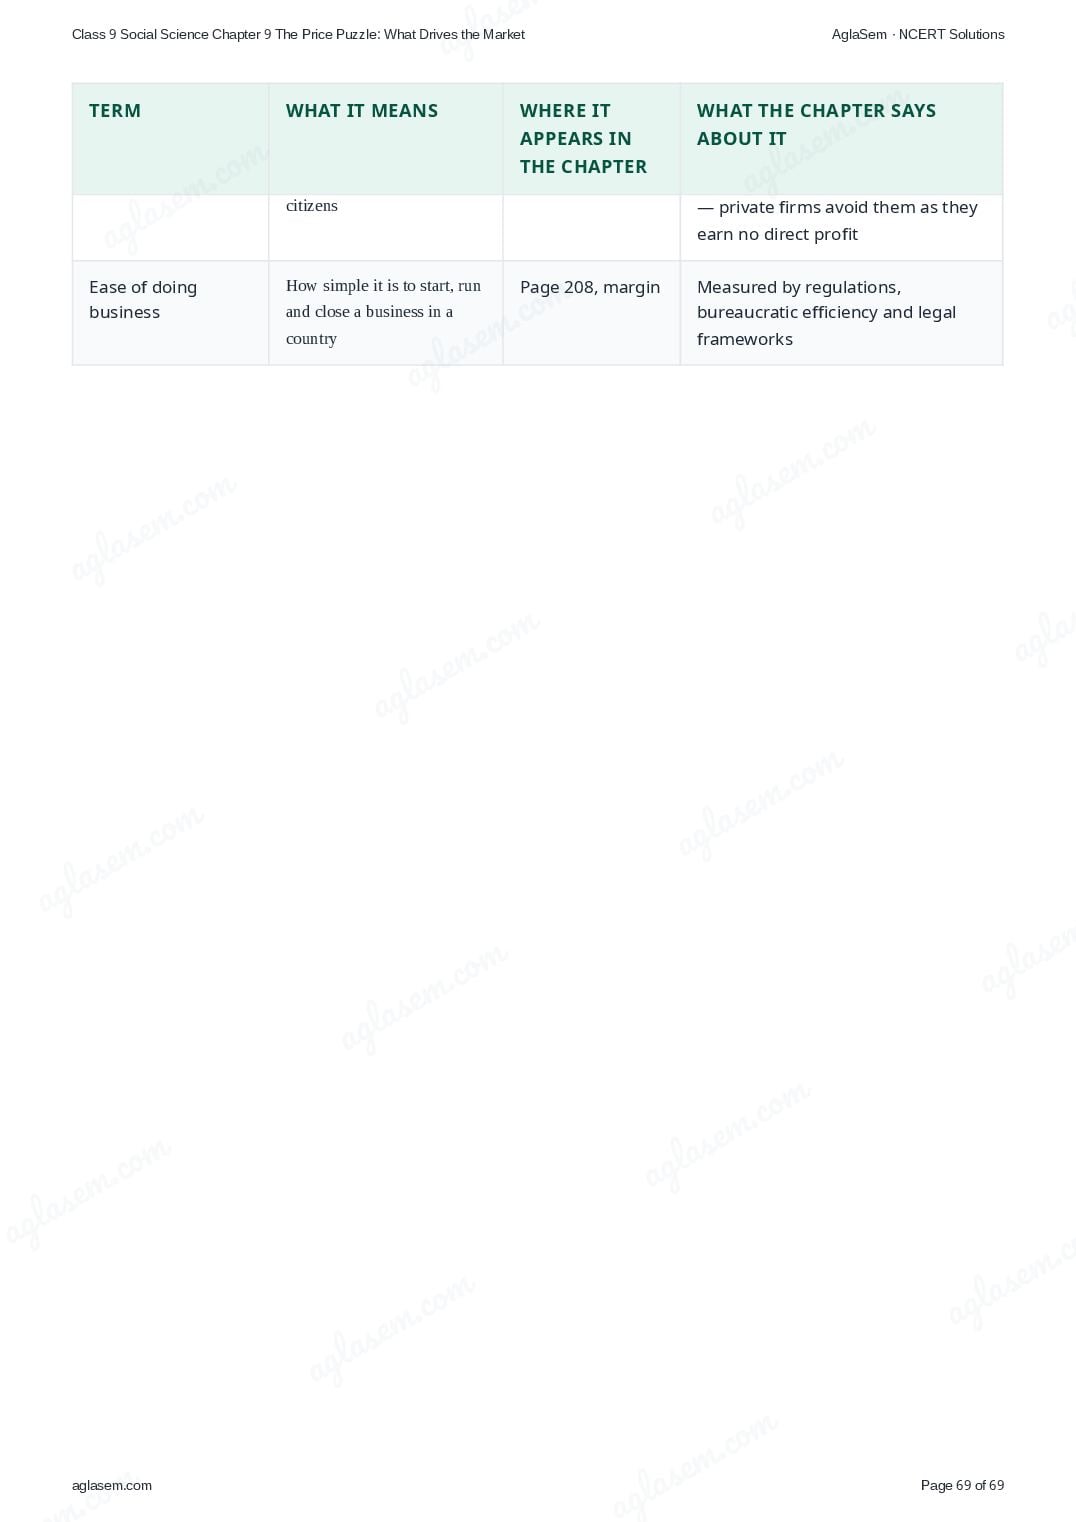
- Governments intervene because markets allocate by willingness and ability to pay: through price ceilings (maximum prices, as on sanitisers at ₹100 for 200 ml under the Essential Commodities Act, 1955), price floors (minimum wages), regulators such as RBI, CCPA, TRAI and SEBI, and the provision of public goods that no private firm would supply. But intervention has limits — price distortions, compliance burdens and weaker incentives to innovate.
How to Download NCERT Solutions for Class 9 Social Science Chapter 9 PDF
Follow these simple steps to get the The Price Puzzle What Drives the Market questions-and-answers PDF from Understanding Society: India and Beyond.
- Search NCERT Solutions for Class 9 Social Science Chapter 9 aglasem and open this page.
- Read the exercise questions with answers for The Price Puzzle What Drives the Market shown above.
- Click the Download PDF link to save the The Price Puzzle What Drives the Market solutions to your device.
NCERT Solutions for Class 9 Social Science – All Chapters
There are more chapters to study besides The Price Puzzle What Drives the Market in Social Science. Here are the NCERT Solutions for all chapters of Class 9 Social Science.
- Chapter 1 Understanding Social Science
- Chapter 2 Shaping of the Earth’s Surface
- Chapter 3 Atmosphere and Climate
- Chapter 4 Early Humans and Beginning of Civilisation
- Chapter 5 State and Society Up to 1000 Ce
- Chapter 6 Democracy
- Chapter 7 Elections
- Chapter 8 Building Blocks in Economics the Problem of Choice
- Chapter 9 The Price Puzzle What Drives the Market
NCERT Solutions for Class 9 – All Subjects
Just like Chapter 9 of Social Science, you can get the exercise questions with answers for every other subject of Class 9. Here are the NCERT Solutions for all subjects of Class 9.
NCERT Solutions for Class 9 Social Science Chapter 9 – An Overview
The key highlights of this study material are as follows.
| Aspects | Details |
|---|---|
| Class | Class 9 |
| Subject | Social Science |
| Chapter Number | Chapter 9 |
| Chapter Name | The Price Puzzle What Drives the Market |
| Book Name | Understanding Society: India and Beyond |
| Book By | NCERT (National Council of Educational Research and Training) |
| Educational Resource Here | NCERT Solutions of Class 9 Social Science Chapter 9 for all exercises |
| More Questions Answers of This Subject | NCERT Solutions for Class 9 Social Science |
| Download Book Chapter | NCERT Book Class 9 Social Science |
| All Questions Answers For This Class | NCERT Solutions for Class 9 |
| Complete Solutions | NCERT Solutions |
NCERT Solutions for Class 9 Social Science Chapter 9 The Price Puzzle What Drives the Market – FAQs
What are the NCERT Solutions for Class 9 Social Science Chapter 9 The Price Puzzle What Drives the Market?
They are the complete, step-by-step answers to all the exercise and in-text questions of Chapter 9 The Price Puzzle What Drives the Market from the NCERT Class 9 Social Science textbook Understanding Society: India and Beyond, written by experts as per the latest NCERT syllabus.
How can I download the Class 9 Social Science Chapter 9 solutions PDF for free?
Open this page on aglasem, read the The Price Puzzle What Drives the Market questions with answers, and click the “Download Solutions PDF” link. The Class 9 Social Science Chapter 9 NCERT Solutions PDF is completely free to download.
Are these NCERT Solutions as per the latest 2026-27 syllabus?
Yes. The NCERT Solutions for Class 9 Social Science Chapter 9 are based on the latest NCERT textbook Understanding Society: India and Beyond and the current 2026-27 CBSE syllabus, so the questions and answers match what you study in class.
Where can I get NCERT Solutions for the other chapters of Class 9 Social Science?
You can find the answers to every chapter on the NCERT Solutions for Class 9 Social Science page, and solutions for every subject on the NCERT Solutions for Class 9 page.
How do NCERT Solutions help in exam preparation?
They show the correct method to solve each question, help you write answers the way they are expected in exams, let you check and correct your own work, and save revision time — which together improve your marks in Class 9 Social Science.
If you have any queries on NCERT Solutions for Class 9 Social Science Chapter 9 The Price Puzzle What Drives the Market, then please ask in the comments below.