NCERT Solutions for Class 7 Maths Chapter 13 Connecting the Dots… – step-by-step answers to every exercise and in-text question of the chapter, as per the latest NCERT syllabus for 2027. Read them online or download the free question-answer PDF.
Chapter 5 of Ganita Prakash Grade 7 Part II is about reading data honestly. It starts with a guess — is the 6-foot-tall friend a man? — and then builds the tools that turn guesses into claims you can defend: the mean, the median, outliers, dot plots and clustered bar graphs. The habit the chapter teaches matters more than any formula: say exactly how much the data lets you say, and no more.
NCERT Solutions for Class 7 Maths Chapter 13 Connecting the Dots… PDF
All the answers are on this page below. The PDF also explains every answer – why it is right and how to check it – so download it for revision.
| Chapter | Download | |
|---|---|---|
| Solutions PDF | Connecting the Dots… | View PDF |
NCERT Solutions for Class 7 Maths Chapter 13 Connecting the Dots… – Questions and Answers
All 86 questions of the chapter (textbook pages Part II, 98 – 134) are answered below, in the order of the book – in-text questions, activities and the end-of-chapter exercises. Each answer is written the way you would write it in the exam.
In-text Questions — Page 98Section 5.1 Of Questions and Statements
(a) What is the price of a tennis ball in India?
(b) How old are the dogs that live on this street?
(c) What fraction of the students in your class like walking up a hill?
(d) Do you like reading?
(e) Approximately how many bricks are in this wall?
(f) Who was the best bowler in the match yesterday?
(g) What was the rainfall pattern in Barmer last year?
Statistical questions: (a), (b), (c), (f) and (g). Not statistical: (d) and (e). A statistical question is answered by collecting data that varies.
| Question | Statistical? | Reason |
|---|---|---|
| (a) Price of a tennis ball in India | Yes | The price is not the same in every shop or every city. You would collect prices and then summarise them. |
| (b) How old are the dogs on this street? | Yes | The dogs are of different ages. You collect the ages and describe them. |
| (c) What fraction of the class likes walking up a hill? | Yes | You must ask every student and count. The answer is a proportion found from data. |
| (d) Do you like reading? | No | This is asked of one person and has one answer, yes or no. Nothing varies, so no data is collected. |
| (e) Approximately how many bricks are in this wall? | No | One particular wall has one fixed number of bricks. Estimating is not the same as collecting data that varies. |
| (f) Who was the best bowler in the match yesterday? | Yes | To answer it you must look at wickets, runs given and overs bowled for each bowler — that is data, and people may still disagree on how to combine it. |
| (g) What was the rainfall pattern in Barmer last year? | Yes | Rainfall changes from month to month. You need the whole year’s readings to describe a pattern. |
Math Talk — Pages 98 – 99Section 5.2 Representative Values
| Match 1 | Match 2 | Match 3 | Match 4 | |
|---|---|---|---|---|
| Shubman | 0 | 17 | 21 | 90 |
| Yashasvi | 67 | 55 | 18 | 35 |
Yashasvi performed better in this series. Both played 4 matches, so the totals can be compared: Yashasvi scored 175 runs, Shubman 128. Yashasvi was also more consistent (18 to 67), while Shubman swung from 0 to 90.
| Way of comparing | Shubman | Yashasvi | Better |
|---|---|---|---|
| Highest score | 90 | 67 | Shubman |
| Total runs | 0+17+21+90 = 128 | 67+55+18+35 = 175 | Yashasvi |
| Mean per match | 128 ÷ 4 = 32 | 175 ÷ 4 = 43.75 | Yashasvi |
| Range (max − min) | 90 − 0 = 90 | 67 − 18 = 49 | Yashasvi (steadier) |
| Matches won head-to-head | Matches 3, 4 | Matches 1, 2 | Equal |
| Match 1 | Match 2 | Match 3 | Match 4 | Match 5 | |
|---|---|---|---|---|---|
| Shubman | 23 | 07 | 10 | 52 | 18 |
| Yashasvi | 26 | 53 | 02 | – | 15 |
Yashasvi performed better — he averaged more runs per match, even though Shubman’s total is larger.
Yashasvi: 26 + 53 + 2 + 15 = 96 runs in 4 matches (he did not play Match 4)
Mean for Shubman = 110 ÷ 5 = 22 runs per match
Mean for Yashasvi = 96 ÷ 4 = 24 runs per match
Her arithmetic is right, but her conclusion is not safe. The two totals are not comparable, because they come from different numbers of matches.
96 runs from 4 matches → 96 ÷ 4 = 24 per match
Yes — one number can represent a group, but it can never replace it.
- The total is one such number, and it works when the groups are the same size.
- The mean (average) works even when the groups differ in size, because it balances the highs and the lows: Shubman 22, Yashasvi 24.
- The highest score and the range are also single numbers, but each tells only one thing.
In-text Questions — Page 100Average as Fair-Share
Each member of Shreyas’s group gets more — 6 guavas each, against 5 each in Parag’s group.
Each member gets 30 ÷ 5 = 6 guavas
Parag’s group: 5 + 4 + 6 + 3 + 4 + 8 = 30 guavas among 6 people
Each member gets 30 ÷ 6 = 5 guavas
Difference = 6 − 5 = 1 guava more each in Shreyas’s group
5 flowers per day.
= (2 + 7 + 9 + 4 + 3) ÷ 5
= 25 ÷ 5
= 5
Figure it Out — Page 101Section 5.2 Representative Values
5 bounces per attempt.
= 8 + 9 + 5 + 4 + 6 + 3 + 5
= 40
Number of attempts = 8
Average = 40 ÷ 8 = 5 bounces
Record at least 7 attempts, add the counts and divide the total by the number of attempts.
Sample answer: suppose your 8 attempts give 3, 5, 1, 7, 4, 6, 4, 2.
Average = 32 ÷ 8 = 4 bounces per attempt
Count the flowers on one plant at the same time each day for 7 days (write 0 on a day with none), add the counts and divide by 7.
Sample answer: a hibiscus plant gives 4, 6, 0, 3, 5, 7, 3 flowers over one week.
Average = 28 ÷ 7 = 4 flowers per day
Neither. Their averages are exactly the same — about 17.43 seconds each.
Nikhil’s mean = 122 ÷ 7 ≈ 17.43 s
Sunil’s total = 20 + 18 + 18 + 17 + 16 + 16 + 17 = 122 s
Sunil’s mean = 122 ÷ 7 ≈ 17.43 s
Mean enrolment = 1859 students.
1555 + 1670 = 3225
3225 + 1750 = 4975
4975 + 2013 = 6988
6988 + 2040 = 9028
9028 + 2126 = 11154
Mean = 11154 ÷ 6 = 1859 students
Math Talk — Pages 101 – 102Know Your Onions!
| Month | Yahapur | Wahapur |
|---|---|---|
| Jan | 25 | 19 |
| Feb | 24 | 17 |
| Mar | 26 | 23 |
| Apr | 28 | 30 |
| May | 30 | 38 |
| Jun | 35 | 35 |
| Jul | 39 | 42 |
| Aug | 43 | 39 |
| Sep | 49 | 53 |
| Oct | 56 | 60 |
| Nov | 59 | 52 |
| Dec | 44 | 42 |
On the whole, onions are slightly costlier in Yahapur — its total (₹458 against ₹450), its average (≈ ₹38.17 against ₹37.50) and its number of dearer months (6 against 5) are higher. But the two towns are very close: Wahapur has the higher median and the single highest price.
| Measure | Yahapur | Wahapur | Costlier |
|---|---|---|---|
| Total of the 12 prices | ₹458 | ₹450 | Yahapur |
| Mean price | 458 ÷ 12 ≈ ₹38.17 | 450 ÷ 12 = ₹37.50 | Yahapur |
| Median price | (35 + 39) ÷ 2 = ₹37 | (38 + 39) ÷ 2 = ₹38.50 | Wahapur |
| Highest price | ₹59 (Nov) | ₹60 (Oct) | Wahapur |
| Lowest price | ₹24 (Feb) | ₹17 (Feb) | Yahapur (never as cheap) |
| Range (max − min) | 59 − 24 = ₹35 | 60 − 17 = ₹43 | Wahapur swings more |
| Months with the higher price | 6 months | 5 months | Yahapur (1 month equal) |
Yes. Some other ways:
- Compare the medians (₹37 and ₹38.50).
- Compare the prices month by month.
- Count the months above ₹50 (Yahapur 2, Wahapur 3).
- Group the prices into bands (₹11–20, ₹21–30, …) and count — as a dot plot does.
- Compare the two halves of the year (Jan–Jun and Jul–Dec).
In-text Questions — Page 103Dot Plots
No. The dot plot keeps every price, but it throws away every month.
| Information | In the table? | In the dot plot? |
|---|---|---|
| All 24 price values | Yes | Yes — one dot each |
| Which town each price belongs to | Yes | Yes — by colour |
| How many times a price repeats | Hard to see | Yes — stacked dots |
| Which month a price belongs to | Yes | No — lost |
| The order of the months | Yes | No — lost |
No, we cannot. The dot plot shows that Yahapur had a price of ₹25 at some point in the year, but nothing on it says when.
Math Talk — Page 104Know Your Onions!
Yahapur ≈ ₹38.17 per kg; Wahapur = ₹37.50 per kg.
= 458
Average = 458 ÷ 12 = ₹38.17 (to two decimal places)
Wahapur: 19 + 17 + 23 + 30 + 38 + 35 + 42 + 39 + 53 + 60 + 52 + 42
= 450
Average = 450 ÷ 12 = ₹37.50
Why are onions cheapest in February and dearest in October–November in both towns? Do the seasons and the new crop decide the price? Why are Wahapur’s prices more spread out than Yahapur’s?
Math Talk — Pages 105 – 106Outliers and Medians
Averages: Yaangba’s family ≈ 164.3 cm, Poovizhi’s family = 160.2 cm. But we cannot safely say Yaangba’s family is taller: four of Poovizhi’s five members are taller than 164 cm, and their average is pulled down by one very short child (118 cm).
Average = 986 ÷ 6 ≈ 164.3 cm
Poovizhi: 170 + 173 + 165 + 118 + 175 = 801 cm, 5 members
Average = 801 ÷ 5 = 160.2 cm
Yes — sort the data and take the middle value. That number is called the Median.
Middle value → Median = 170 cm
Yaangba’s family sorted: 155, 160, 164, 165, 169, 173
Even number of values, so take the average of the two middle ones
Median = (164 + 165) ÷ 2 = 164.5 cm
Yes, for Poovizhi’s family. Its median (170 cm) is close to most members’ heights, while its mean (160.2 cm) is lower than 4 of the 5 heights because of the outlier 118 cm. For Yaangba’s family (no outlier) the mean and median are almost equal, so either works.
| Family | Mean | Median | Gap | Outlier? |
|---|---|---|---|---|
| Yaangba | 164.3 cm | 164.5 cm | 0.2 cm | None |
| Poovizhi | 160.2 cm | 170 cm | 9.8 cm | 118 cm |
In-text Questions — Pages 107 – 108Are you a bookworm?
Without the outlier the mean jumps by more than 10 cm, while the median barely moves.
Sum = 165 + 170 + 173 + 175 = 683 cm, 4 values
New mean = 683 ÷ 4 = 170.75 cm
Sorted: 165, 170, 173, 175 (even count)
New median = (170 + 173) ÷ 2 = 171.5 cm
| With 118 cm | Without 118 cm | Change | |
|---|---|---|---|
| Mean | 160.2 cm | 170.75 cm | +10.55 cm |
| Median | 170 cm | 171.5 cm | +1.5 cm |
Guess: the mean will be greater than the median, because one student read 40 stories — far more than everyone else.
= 122
Mean = 122 ÷ 15 ≈ 8.13 stories
Sorted: 0, 0, 1, 2, 3, 5, 5, 6, 7, 8, 8, 10, 12, 15, 40
15 values, so the middle one is the 8th → Median = 6 stories
The number line runs from 0 to 40. Place one dot for each value, stacking repeats. Then draw a solid line at the mean 8.13 and a dashed line at the median 6.
| Value | 0 | 1 | 2 | 3 | 5 | 6 | 7 | 8 | 10 | 12 | 15 | 40 |
|---|---|---|---|---|---|---|---|---|---|---|---|---|
| Number of dots | 2 | 1 | 1 | 1 | 2 | 1 | 1 | 2 | 1 | 1 | 1 | 1 |
40 is the outlier.
Next highest value after 40 is 15
Gap between them = 40 − 15 = 25 stories
Gap between any other neighbouring pair ≤ 3
Removing 40 pulls the mean down by more than 2 stories; the median drops by only half a story.
New mean = 82 ÷ 14 ≈ 5.86 stories
Sorted: 0, 0, 1, 2, 3, 5, 5, 6, 7, 8, 8, 10, 12, 15
Even count, so New median = (5 + 6) ÷ 2 = 5.5 stories
| With 40 | Without 40 | Change | |
|---|---|---|---|
| Mean | 8.13 | 5.86 | −2.27 |
| Median | 6 | 5.5 | −0.5 |
In-text Questions — Page 108Are We on the Same Page?
Different. The number of pages changes from day to day. For the newspaper in the book it is 16, 18, 20, 22, 26, 16, 10 from Monday to Sunday — most on Friday (26) and fewest on Sunday (10).
| Day | Mon | Tue | Wed | Thu | Fri | Sat | Sun |
|---|---|---|---|---|---|---|---|
| Pages | 16 | 18 | 20 | 22 | 26 | 16 | 10 |
The number line runs from 0 to 25 and a little beyond. Place the seven dots, stacking the two 16s, then draw the mean at 18.29 and the median at 18.
Math Talk — Pages 108 – 109Measures of Central Tendency
(a) the mean and median are close to each other
(b) the mean and median are comparatively far apart, with mean < median
(c) the mean and median are comparatively far apart, with mean > median
Each of the three examples illustrates exactly one of the three cases.
| Case | Example | Mean | Median | What the data looks like |
|---|---|---|---|---|
| (a) close together | Newspaper pages 10, 16, 16, 18, 20, 22, 26 | 18.29 | 18 | Values spread out evenly, no value far from the rest |
| (b) mean < median | Poovizhi’s family 118, 165, 170, 173, 175 | 160.2 | 170 | One value far below the rest — a low outlier |
| (c) mean > median | Short stories 0, 0, 1, 2, 3, 5, 5, 6, 7, 8, 8, 10, 12, 15, 40 | 8.13 | 6 | One value far above the rest — a high outlier |
With outliers on both sides the two pulls work against each other. The median hardly changes; the mean moves towards the outlier that is farther from the middle, and stays near the median if the two outliers balance.
| Example data | Mean | Median | Result |
|---|---|---|---|
| 2, 18, 19, 20, 21, 22, 38 | 140 ÷ 7 = 20 | 20 | mean = median |
| 2, 18, 19, 20, 21, 22, 60 | 162 ÷ 7 ≈ 23.14 | 20 | mean > median |
| 0, 18, 19, 20, 21, 22, 26 | 126 ÷ 7 = 18 | 20 | mean < median |
In-text Questions — Pages 109 – 110Of Ends and the Essence — How Tall is Your Class?
the class is about 145 cm tall on average (mean 144.5 cm, median 145 cm), and every student is between 128 cm and 158 cm. Boys: mean ≈ 142.94 cm, median 144 cm; girls: mean ≈ 146.9 cm, median 148 cm.
Four things can be said, and the book states them all.
| Boys (17) | Girls (11) | Whole class (28) | |
|---|---|---|---|
| Shortest | 128 cm | 136 cm | 128 cm |
| Tallest | 158 cm | 156 cm | 158 cm |
| Range | 30 cm | 20 cm | 30 cm |
| Mean | 142.94 cm | 146.9 cm | 144.5 cm |
| Median | 144 cm | 148 cm | 145 cm |
- The boys’ heights are more spread out, from 128 to 158 cm. The girls lie in a narrower band, 136 to 156 cm.
- Both the tallest and the shortest student in the class are boys.
- Yet the boys’ mean is below the class mean and below the girls’ mean. In this class the girls are taller on average.
- For both groups mean < median (142.94 < 144 and 146.9 < 148), which shows a small pull from values on the lower side.
15 students out of 28 are taller than the class average of 144.5 cm.
128, 130, 134, 135, 135, 136, 140, 140, 141, 142, 143, 144, 144,
145, 145, 146, 146, 147, 148, 150, 150, 150, 150, 154, 154, 155, 156, 158
Class mean = 144.5 cm
Heights above 144.5: 145, 145, 146, 146, 147, 148, 150, 150, 150, 150, 154, 154, 155, 156, 158
Count = 15 students
8 boys are taller than 144.5 cm.
145, 146, 146, 147, 150, 154, 155, 158
Boys above 144.5 cm: 145, 146, 146, 147, 150, 154, 155, 158 → 8 boys
Boys at or below 144.5 cm: 17 − 8 = 9 boys
Math Talk — Page 110How long is a minute?
Both groups did well — most children opened their eyes between about 55 and 65 seconds. Group B was slightly better as a whole: its mean (59.28 s) is closer to 60 s and almost equal to its median (59.5 s). Group A’s median is exactly 60 s, but a few very early openers (as early as 42 s) pull its mean down to 58.21 s. Group A’s dots spread from 42 s to 68 s, Group B’s from 47 s to 71 s.
| Group A | Group B | |
|---|---|---|
| Mean | 58.21 s | 59.28 s |
| Median | 60 s | 59.5 s |
| Distance of mean from 60 s | 1.79 s | 0.72 s |
| Gap between mean and median | 1.79 s | 0.22 s |
| Spread of the dots | 42 s to 68 s | 47 s to 71 s |
In-text Questions — Page 111Zero Median Runs Scored! / Zero vs No value
Yes, it can. The median only depends on the middle value of the sorted scores, so it says nothing about the total.
If 6 or more players score 0, that 6th score is 0 → median = 0.
Example: 0, 0, 0, 0, 0, 0, 12, 41, 96, 108, 131
Median = 6th value = 0
Runs off the bat = 0×6 + 12 + 41 + 96 + 108 + 131 = 388
Extras = 19
Team total = 388 + 19 = 407
Figure it Out — Pages 112 – 113Section 5.2 Representative Values
Yahapur: ₹37. Wahapur: ₹38.50.
12 values, so average the 6th and the 7th
Median = (35 + 39) ÷ 2 = 74 ÷ 2 = ₹37
Wahapur sorted: 17, 19, 23, 30, 35, 38, 39, 42, 42, 52, 53, 60
Median = (38 + 39) ÷ 2 = 77 ÷ 2 = ₹38.50
Mean = 3.6 animals; Median = 2 animals. The two dashes are absent students, so they are left out: 20 values.
Mean = 72 ÷ 20 = 3.6
Sorted: 0, 0, 0, 0, 0, 0, 1, 1, 1, 2, 2, 2, 3, 4, 4, 4, 5, 8, 10, 25
Median = (10th + 11th) ÷ 2 = (2 + 2) ÷ 2 = 2
Description: most students have 0 to 2 animals; 25 is an outlier, so the mean is pulled above the median. The median (2) describes a typical home better.
Mean ≈ 55.9 feet, Median = 56 feet; 13 trees are shorter than the average.
Median = 15th of the 29 sorted heights = 56 ft
Shorter than 55.9 ft: 43, 44, 45, 46, 49, 50, 51, 52, 52, 54, 54, 55, 55 → 13 trees
Description: heights from 43 to 67 ft, mostly in the 50s and low 60s; no outlier, and mean ≈ median. Quicker way: add the differences from 55 ft (total +26), so mean = 55 + 26 ÷ 29 ≈ 55.9 ft.
(a) Can the mean or median daily usage lie between 25 and 30? Justify your claim using the meaning of mean and median.
(b) Can the mean or median be lesser than the minimum value or greater than the maximum value in a data?
(a) No. The largest reading is only 20.5 litres. The mean is a fair share of the total, so it cannot be more than the largest value; the median is a middle value of the sorted data, so it also lies between 3.09 and 20.5. (Here the mean ≈ 9.71 L and the median = 8 L.)
(b) No. The mean and the median always lie between the minimum and the maximum of the data (they can equal them, but never go outside).
| Boys | 3.5 | 4.1 | 2.6 | 3.2 | 3.4 | 3.8 |
|---|---|---|---|---|---|---|
| Girls | 4.0 | 3.1 | 3.4 | 3.7 | 2.5 | 3.4 |
Dot plot of the twelve weights (drawn here from 2 to 4.5 kg):
Sum = 20.6 kg, Mean = 20.6 ÷ 6 ≈ 3.43 kg
Median = (3.4 + 3.5) ÷ 2 = 3.45 kg
Girls: 2.5, 3.1, 3.4, 3.4, 3.7, 4.0
Sum = 20.1 kg, Mean = 20.1 ÷ 6 = 3.35 kg
Median = (3.4 + 3.4) ÷ 2 = 3.4 kg
| Boys | Girls | |
|---|---|---|
| Lightest | 2.6 kg | 2.5 kg |
| Heaviest | 4.1 kg | 4.0 kg |
| Range | 1.5 kg | 1.5 kg |
| Mean | 3.43 kg | 3.35 kg |
| Median | 3.45 kg | 3.40 kg |
Comparison: the two groups are very alike — the same range (1.5 kg), and means and medians that differ by less than 0.1 kg. These boys and girls weighed about the same at birth, roughly 3.4 kg.
- Girls’ heights are more spread out (about 126 to 158 cm) than boys’ (about 130 to 148 cm), so the tallest and the shortest students are both girls.
- Most boys are bunched at 142–146 cm, so the boys are taller on average in this section (mean 142.05 cm against 140.14 cm).
- Whole class and boys: mean < median, a small pull from a few short students; girls: mean ≈ median.
- Compared with Section 1 (page 109), this section is shorter on average (mean 141.21 cm against 144.5 cm), and the result reverses — there the girls were taller, here the boys are.
| Section 1 (page 109) | Section 2 | Difference | |
|---|---|---|---|
| Whole class mean | 144.5 cm | 141.21 cm | Section 1 taller by ≈ 3.3 cm |
| Whole class median | 145 cm | 142.5 cm | Section 1 taller by 2.5 cm |
| Boys’ mean | 142.94 cm | 142.05 cm | Almost the same |
| Girls’ mean | 146.9 cm | 140.14 cm | Section 1 girls taller by ≈ 6.8 cm |
| Taller group | Girls | Boys | Reversed! |
| Widest spread | Boys | Girls | Reversed! |
About 5.7 times — roughly 6 times heavier.
295.2 + 250.7 + 234.1 + 221.0 + 200.9 = 1201.9 kg
Mean = 1201.9 ÷ 5 = 240.38 kg
Ballet dancers (6 people):
40.3 + 37.6 + 38.8 + 45.5 + 44.1 + 48.2 = 254.5 kg
Mean = 254.5 ÷ 6 ≈ 42.42 kg
How many times heavier = 240.38 ÷ 42.42 ≈ 5.67
In-text Questions — Pages 114 – 115Section 5.3 Visualising Data — Clubbing the Columns
| Jan | Feb | Mar | Apr | May | Jun | Jul | Aug | Sep | Oct | Nov | Dec | |
|---|---|---|---|---|---|---|---|---|---|---|---|---|
| Yahapur | 25 | 24 | 26 | 28 | 30 | 35 | 39 | 43 | 49 | 56 | 59 | 44 |
| Wahapur | 19 | 17 | 23 | 30 | 38 | 35 | 42 | 39 | 53 | 60 | 52 | 42 |
Yes, it matches. Check the two bars of each cluster against the two rows of the table, month by month.
| Month | Jan | Feb | Mar | Apr | May | Jun | Jul | Aug | Sep | Oct | Nov | Dec |
|---|---|---|---|---|---|---|---|---|---|---|---|---|
| Yahapur (₹) | 25 | 24 | 26 | 28 | 30 | 35 | 39 | 43 | 49 | 56 | 59 | 44 |
| Wahapur (₹) | 19 | 17 | 23 | 30 | 38 | 35 | 42 | 39 | 53 | 60 | 52 | 42 |
| Taller bar | Y | Y | Y | W | W | = | W | Y | W | W | Y | Y |
1 unit length = ₹10 per kg. The vertical line is marked 0, 10, 20, 30, 40, 50, 60.
Gap between two gridlines = ₹10
Highest gridline needed = 60, because the largest price is ₹60 (Wahapur, October)
Yes — much easier. The two bars for each month stand side by side, so we see at once which town was dearer that month and roughly by how much (for example, May: Wahapur dearer by ₹8; June: equal).
In-text Questions — Pages 116 – 11810…9…8…7…6…5…4…3…2…1…Take Off!
Observations: SpaceX (USA) launched by far the most rockets, and its launches grew fast (about 31 → 61 → 96). CASC (China) comes second. Roscosmos (Russia), Arianespace (France), Rocket Lab and United Launch Alliance (USA), ISRO (India), Galactic Energy and Expace (China) launched far fewer. ISRO’s launches rose every year; Arianespace’s fell every year.
| Organisation | Country | 2021 | 2022 | 2023 |
|---|---|---|---|---|
| SpaceX | USA | ≈ 31 | ≈ 61 | ≈ 96 |
| CASC | China | ≈ 48 | ≈ 35 | ≈ 45 |
| Roscosmos | Russia | ≈ 16 | ≈ 21 | ≈ 18 |
| Arianespace | France | ≈ 15 | ≈ 6 | ≈ 3 |
| Rocket Lab | USA | ≈ 6 | ≈ 6 | ≈ 9 |
| United Launch Alliance | USA | ≈ 5 | ≈ 8 | ≈ 3 |
| ISRO | India | ≈ 2 | ≈ 5 | ≈ 7 |
| Galactic Energy | China | ≈ 1 | ≈ 2 | ≈ 7 |
| Expace | China | ≈ 4 | ≈ 4 | ≈ 6 |
| Other | many | ≈ 18 | ≈ 17 | ≈ 26 |
Organisation: each organisation has three adjacent bars, for 2021, 2022 and 2023. Scale: 1 unit length = 20 rockets (marks 0, 20, 40, 60, 80, 100). Patterns: SpaceX increases year on year (its 2022 bar is almost double its 2021 bar); Arianespace decreases year on year (2023 about half of 2022); United Launch Alliance increases, then decreases. ‘Others’ groups many small organisations.
- The USA, China and Russia are the leading rocket-launching countries.
- SpaceX launched about twice as many rockets in 2022 as in 2021, and about 35 more in 2023 than in 2022.
- Arianespace’s launches fell every year.
- United Launch Alliance launched more in 2022 than in 2021, but fewer in 2023 than in either year.
- Other organisations launched about 25 rockets in 2023.
(a) All organisations launched more rockets than the previous years.
(b) Only an organisation from the USA launched more than 50 rockets in a single year.
(c) The total number of rockets launched by France in all 3 years is less than 40.
(d) The average number of rockets launched by CASC in these 3 years is around 40.
(e) ISRO launched more rockets than Galactic Energy in these 3 years.
(f) Russia launched more than 60 rockets in these 3 years.
Justified: (b), (c), (d) and (e). Not justified: (a) and (f).
| Statement | Justified? | The evidence in the graph |
|---|---|---|
| (a) All organisations increased every year | No | Arianespace fell every year; CASC fell in 2022; United Launch Alliance and Roscosmos fell in 2023. One counter-example is enough to break a claim that says all. |
| (b) Only a USA organisation crossed 50 in one year | Yes | SpaceX (USA) passed 50 twice — about 61 in 2022 and about 96 in 2023. The next longest bar anywhere is CASC’s 2021 bar at about 48, which does not reach the halfway point between the 40 and 60 marks. |
| (c) France’s total over 3 years is less than 40 | Yes | France’s only entry is Arianespace: about 15 + 6 + 3 = 24, comfortably under 40. |
| (d) CASC averages around 40 | Yes | About 48 + 35 + 45 = 128, and 128 ÷ 3 ≈ 42.7 — which is “around 40”. |
| (e) ISRO launched more than Galactic Energy | Yes | ISRO ≈ 2 + 5 + 7 = 14; Galactic Energy ≈ 1 + 2 + 7 = 10. Their 2023 bars are nearly equal, but ISRO’s 2021 and 2022 bars are clearly longer. |
| (f) Russia launched more than 60 in 3 years | No | Russia’s only entry is Roscosmos: about 16 + 21 + 18 = 55, which is below 60. |
Reading the three bars of each cluster from dark to light, the ones that get longer every single time are:
- SpaceX — about 31 → 61 → 96
- ISRO — about 2 → 5 → 7
- Galactic Energy — about 1 → 2 → 7
(a) less than 200
(b) 200 to 400
(c) 400 to 600
(d) more than 600
(b) 200 to 400. Adding the ten 2023 bars (the lightest ones) gives roughly 220.
CASC ≈ 45
Roscosmos ≈ 18
Arianespace ≈ 3
Rocket Lab ≈ 9
United Launch Alliance ≈ 3
ISRO ≈ 7
Galactic Energy ≈ 7
Expace ≈ 6
Other ≈ 26
Total ≈ 220
Why does the USA launch so many more rockets than other countries? What were the numbers before 2021 and after 2023? Which organisations are inside ‘Others’? How many of these launches were successful?
Math Talk — Pages 118 – 121Summer and Winter at the Same Time
City 1
| Jan | Feb | Mar | Apr | May | Jun | Jul | Aug | Sep | Oct | Nov | Dec |
|---|---|---|---|---|---|---|---|---|---|---|---|
| 210 | 257 | 372 | 441 | 536 | 564 | 555 | 465 | 394 | 310 | 222 | 186 |
City 2
| Jan | Feb | Mar | Apr | May | Jun | Jul | Aug | Sep | Oct | Nov | Dec |
|---|---|---|---|---|---|---|---|---|---|---|---|
| 459 | 384 | 381 | 327 | 304 | 276 | 295 | 318 | 369 | 409 | 435 | 468 |
The data is the number of hours of daylight in each month (hours when the Sun is at least partly above the horizon).
Reason: dividing by the number of days gives a sensible number of hours per day (City 1: 564 ÷ 30 ≈ 18.8 h in June, 186 ÷ 31 = 6 h in December), and the two cities change in opposite directions through the year.
Yes. City 1 has its longest days in June, so it is in the Northern Hemisphere; City 2 has its shortest days in June, so it is in the Southern Hemisphere. The large change in day length through the year shows that both are far from the Equator. (City 1 is Helsinki, Finland; City 2 is Wellington, New Zealand.)
How long are the days in my own town in each month? What happens at the Equator, and near the poles, where the Sun can be seen at midnight in summer? Does longer daylight always mean hotter weather?
In-text Questions — Page 122All it Takes is a Minute
Yes, it can be worked out: the blue team batted first, and the blue team won by 11 runs.
First read the bars, over by over. The scale is 1 unit = 5 runs.
| Over | 1 | 2 | 3 | 4 | 5 | 6 | 7 | 8 | 9 | 10 | 11 | 12 | 13 | 14 | 15 | 16 | 17 | 18 | 19 | 20 |
|---|---|---|---|---|---|---|---|---|---|---|---|---|---|---|---|---|---|---|---|---|
| Blue | 2 | 11 | 8 | 7 | 9 | 6 | 3 | 4 | 9 | 8 | 6 | 15 | 6 | 9 | 4 | 10 | 9 | 13 | 17 | 7 |
| Red | 10 | 8 | 4 | 2 | 11 | 8 | 3 | 6 | 10 | 9 | 9 | 5 | 16 | 11 | 9 | 7 | 7 | 17 | — | — |
Red total = 10+8+4+2+11+8+3+6+10+9+9+5+16+11+9+7+7+17 = 152 runs in 18 overs
The blue team had 156 runs after 19 overs — already more than the red team’s 152 — yet it still batted the 20th over, so it was not chasing: blue batted first. The red team batted second, and its innings stopped after 18 overs.
15 runs.
In over 12 the blue bar reaches exactly the third gridline
Runs = 3 × 5 = 15
Over 4, with 2 runs — the shortest red bar in the whole graph.
Over 4 → 2 runs (shortest)
Over 7 → 3 runs
Over 3 → 4 runs
Over 12 → 5 runs
No, not easily. The graph shows the runs in each over, not the running total. To find the target we must read all 20 blue bars and add them: 163 runs, so the target was 164.
Figure it Out — Pages 122 – 125Section 5.3 Visualising Data
(a) What is the scale used in this graph?
(b) What did you find interesting in this infographic? What do you want to explore further?
(c) Identify a pair of creatures where one’s speed is about twice that of the other.
(d) Can we say that a sailfish is about 4 times faster than a humpback whale? Can we say that a sailfish is the fastest aquatic animal in the world?
Yes. Each animal has one bar whose length shows its top speed, all on the same scale.
(a) 1 unit length = 16 kilometres per hour (marks 0, 16, 32, 48, … up to 322 kph).
(b) Sample answer: the fastest animal is a bird, the peregrine falcon (322 kph). I would like to explore which animals are fastest for their body size.
(c) Sailfish (109 kph) and flying fish (56 kph): 109 ÷ 56 ≈ 2. (Also: peregrine falcon 322 kph and spine-tailed swift 170 kph.)
(d) No, to both. The humpback whale is not in this infographic, so the first claim cannot be checked. The graph shows only four water animals, so it tells us only that the sailfish is the fastest of these four.
| Grade 5 | w, a, a, a, w, n, s, a, n, w, a, a, a, a, a, w, w, s, a, a, n, w, a, a, n |
|---|---|
| Grade 9 | n, w, s, a, s, w, s, s, a, a, w, s, s, a, s, a, n, w, s, s, a, w, a, w, a |
First count each letter. Both grades have 25 students, so the two sets of bars can be compared directly.
| Choice | Grade 5 | Grade 9 |
|---|---|---|
| Aquatic (w) | 6 | 6 |
| Aerial (a) | 13 | 8 |
| Spaceborne (s) | 2 | 9 |
| None (n) | 4 | 2 |
| Total | 25 | 25 |
Scale: 1 unit length = 2 students (the largest count is 13, so the vertical line goes up to 14).
Observation: most Grade 5 students chose aerial (13 of 25); Grade 9 students chose spaceborne most (9, against only 2 in Grade 5). Both grades had 6 students choosing aquatic.
| 12 am | 3 am | 6 am | 9 am | 12 pm | 3 pm | 6 pm | 9 pm | |
|---|---|---|---|---|---|---|---|---|
| Day 1 | 20°C | 18°C | 16°C | 20°C | 26°C | 34°C | 30°C | 24°C |
| Day 2 | 37°C | 34°C | 30°C | 33°C | 37°C | 43°C | 42°C | 39°C |
With the scale 1 unit = 4°C, the vertical line is marked 0, 4, 8, 12, 16, 20, 24, 28, 32, 36, 40, 44. The highest reading is 43°C, so 44 is the top gridline.
Months: Day 2 (30°C to 43°C) is a peak-summer day — May or June. Day 1 (16°C to 34°C) is a milder day — about February–March or October–November.
(a) The data (rounded-off to thousands) for the states of Gujarat and Delhi are given in the table below. Mark the corresponding bars on the bar graph.
(b) Notice how the graph is organised, what scale is used, and what patterns the data shows.
(c) How would you describe the change for various states between 2022 and 2024?
(d) Approximately how many more registrations did Assam get in 2023 compared to 2022?
(e) How many times more did the registrations in West Bengal increase from 2022 to 2024?
(f) Is this statement correct — ‘There were very few new registrations in Uttarakhand in 2023 and 2024, as the increase in the bar lengths is minimal’?
| 2022 | 2023 | 2024 | |
|---|---|---|---|
| Gujarat | 69000 | 89000 | 78000 |
| Delhi | 62000 | 74000 | 81000 |
| State | 2022 | 2023 | 2024 |
|---|---|---|---|
| Uttarakhand | ≈ 15,000 | ≈ 16,000 | ≈ 19,000 |
| West Bengal | ≈ 10,000 | ≈ 21,000 | ≈ 43,000 |
| Andhra Pradesh | ≈ 29,000 | ≈ 34,000 | ≈ 55,000 |
| Odisha | ≈ 27,000 | ≈ 44,000 | ≈ 62,000 |
| Assam | ≈ 40,000 | ≈ 60,000 | ≈ 64,000 |
| Gujarat (given) | 69,000 | 89,000 | 78,000 |
| Delhi (given) | 62,000 | 74,000 | 81,000 |
(a) Draw the Gujarat and Delhi bars to the heights in the table (for example, Gujarat 2023 just below the 90,000 line — the tallest bar of all).
(b) Three bars per state (2022, 2023, 2024); labels every 25,000, guidelines every 5,000.
(c) Every state registered more in 2024 than in 2022; West Bengal grew fastest (more than 4 times); Gujarat fell in 2024.
(d) About 60,000 − 40,000 = 20,000 more. (e) About 43,000 ÷ 10,000 ≈ 4 times.
(f) No. Each bar shows that year’s new registrations — about 16,000 in 2023 and 19,000 in 2024 in Uttarakhand — which is not “very few”. The small change in bar length only shows that the yearly number grew slowly.
Math Talk — Pages 125 – 126Section 5.4 Data Detective — Telling Tall Tales
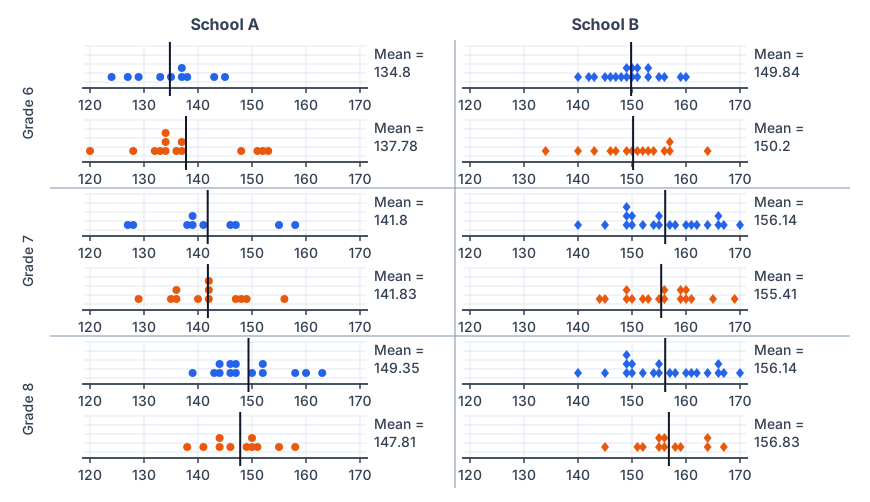
- School B’s students are much taller than School A’s in every grade (Grade 6 boys: 149.84 cm against 134.8 cm — about 15 cm more).
- Heights increase from Grade 6 to Grade 8 in both schools.
- Boys and girls of the same grade have almost the same mean height; sometimes the girls are a little taller, sometimes the boys.
- The dots in each plot are spread over about 20 cm, so many girls are taller than many boys.
| Grade | School A boys | School A girls | School B boys | School B girls | B − A (boys) |
|---|---|---|---|---|---|
| Grade 6 | 134.80 | 137.78 | 149.84 | 150.20 | +15.0 cm |
| Grade 7 | 141.80 | 141.83 | 156.14 | 155.41 | +14.3 cm |
| Grade 8 | 149.35 | 147.81 | 156.14 | 156.83 | +6.8 cm |
Math Talk — Pages 127 – 128Telling Tall Tales — heights in India, 1989 to 2019
• Changes in the heights of boys or girls of a certain age from 1989 to 2019.
• The heights of boys vs. girls at different ages in a particular year.
• Changes in height between successive ages in boys and girls in 2019.
| Age | 1989 | 1999 | 2009 | 2019 | ||||
|---|---|---|---|---|---|---|---|---|
| Boys | Girls | Boys | Girls | Boys | Girls | Boys | Girls | |
| 5 | 101.3 | 100 | 102.4 | 101.7 | 105.1 | 104 | 107.1 | 107.2 |
| 6 | 107.5 | 106 | 108.7 | 107.5 | 111 | 109.7 | 113.1 | 112.9 |
| 7 | 113 | 111.4 | 114.2 | 112.6 | 116.2 | 114.8 | 118.6 | 118 |
| 8 | 118.1 | 116.5 | 119.2 | 117.5 | 120.9 | 119.6 | 123.5 | 122.7 |
| 9 | 122.9 | 121.7 | 123.9 | 122.4 | 125.2 | 124.5 | 128.1 | 127.6 |
| 10 | 127.5 | 127.3 | 128.3 | 127.8 | 129.4 | 129.9 | 132.6 | 132.8 |
| 11 | 132.2 | 133.4 | 132.8 | 133.6 | 133.7 | 135.7 | 137 | 138.6 |
| 12 | 137.7 | 139 | 138 | 139.1 | 138.9 | 141.1 | 142.2 | 143.8 |
| 13 | 144.2 | 143.2 | 144.3 | 143.1 | 145.2 | 145.1 | 148.4 | 147.7 |
| 14 | 150.6 | 146.2 | 150.5 | 146.1 | 151.5 | 148 | 154.4 | 150.4 |
| 15 | 155.4 | 148.5 | 155.2 | 148.4 | 156.3 | 150.1 | 159 | 152.4 |
| 16 | 158.9 | 150.1 | 158.7 | 150.1 | 159.9 | 151.6 | 162.3 | 153.8 |
| 17 | 161.3 | 151.2 | 161.4 | 151.3 | 162.6 | 152.6 | 164.6 | 154.7 |
| 18 | 162.9 | 151.8 | 163.2 | 152.1 | 164.3 | 153 | 166 | 155.2 |
| 19 | 163.5 | 151.9 | 164.2 | 152.4 | 165.1 | 153 | 166.5 | 155.2 |
Sample findings:
- At every age, both boys and girls were taller in 2019 than in 1989 (5-year-olds by about 6 to 7 cm).
- Boys are a little taller at ages 5 to 9; girls are taller at ages 11 and 12; from 13 onwards boys are taller (by 11.3 cm at age 19 in 2019).
- In 2019 girls grew fastest between ages 10 and 11, boys between 12 and 13; by 18–19 growth has almost stopped.
1. The average heights of both boys and girls at every age increased from 1989 to 2019.
2. The average height of 13-year-old girls in 1989 is more than the average height of 14-year-old girls in 2009.
3. The average height of 15-year-old boys in 2019 is more than the average height of 16-year-old boys in 1989.
4. All girls aged 13 are taller than all girls aged 11.
5. Throughout the age period 5 to 19, the average boy’s height is more than the average girl’s height.
6. Boys keep growing even beyond age 19.
Can be justified: 1 and 3. Cannot be justified: 2, 4, 5 and 6.
| Statement | Justified? | The evidence |
|---|---|---|
| 1. Every age increased, 1989 → 2019 | Yes | Compare the 1989 and 2019 columns row by row. Every one of the 15 ages is higher in 2019, for boys and for girls. |
| 2. 13-year-old girls in 1989 > 14-year-old girls in 2009 | No | 1989, age 13 girls = 143.2 cm. 2009, age 14 girls = 148.0 cm. So 143.2 < 148.0 — the statement is the wrong way round. |
| 3. 15-year-old boys in 2019 > 16-year-old boys in 1989 | Yes | 2019, age 15 boys = 159.0 cm. 1989, age 16 boys = 158.9 cm. True — but by only 0.1 cm. |
| 4. All girls aged 13 are taller than all girls aged 11 | No | The table gives averages only. It contains nothing at all about individual girls, so it can neither prove nor disprove a claim about every girl. |
| 5. Boys taller than girls throughout ages 5 to 19 | No | At ages 11 and 12, girls are taller in all four years. In 2019, age 11: girls 138.6 vs boys 137.0; age 12: girls 143.8 vs boys 142.2. Girls are also taller at age 10 in 2009 and 2019. |
| 6. Boys keep growing beyond age 19 | No | The table stops at 19, so it holds no evidence either way. What it does show is that growth is nearly over: boys gain only 0.5 cm from 18 to 19 in 2019. |
Boys grew most between ages 12 and 13 (+6.2 cm). Girls grew most between ages 10 and 11 (+5.8 cm).
12 → 13: 148.4 − 142.2 = 6.2 cm (largest)
5 → 6: 113.1 − 107.1 = 6.0 cm
13 → 14: 154.4 − 148.4 = 6.0 cm
Girls 2019, biggest steps:
10 → 11: 138.6 − 132.8 = 5.8 cm (largest)
5 → 6: 112.9 − 107.2 = 5.7 cm
9 → 10: 132.8 − 127.6 = 5.2 cm
11 → 12: 143.8 − 138.6 = 5.2 cm
Sample estimate: growth is fastest in the first year and then slows down, so heights of about 75 cm at age 1, 87 cm at age 2, 95 cm at age 3 and 101 cm at age 4 (from 50 cm at birth to about 107 cm at age 5 in 2019).
| Age | Birth | 1 | 2 | 3 | 4 | 5 |
|---|---|---|---|---|---|---|
| Even-share estimate | 50 | 61 | 73 | 84 | 96 | 107 |
| Slowing-growth estimate | 50 | ≈ 75 | ≈ 87 | ≈ 95 | ≈ 101 | 107 |
| Growth that year (cm) | — | 25 | 12 | 8 | 6 | 6 |
| Age | 1989 | 1999 | 2009 | 2019 | ||||
|---|---|---|---|---|---|---|---|---|
| Boys | Girls | Boys | Girls | Boys | Girls | Boys | Girls | |
| 5 | 101.3 | 100 | 102.4 | 101.7 | 105.1 | 104 | 107.1 | 107.2 |
| 6 | 107.5 | 106 | 108.7 | 107.5 | 111 | 109.7 | 113.1 | 112.9 |
| 7 | 113 | 111.4 | 114.2 | 112.6 | 116.2 | 114.8 | 118.6 | 118 |
| 8 | 118.1 | 116.5 | 119.2 | 117.5 | 120.9 | 119.6 | 123.5 | 122.7 |
| 9 | 122.9 | 121.7 | 123.9 | 122.4 | 125.2 | 124.5 | 128.1 | 127.6 |
| 10 | 127.5 | 127.3 | 128.3 | 127.8 | 129.4 | 129.9 | 132.6 | 132.8 |
| 11 | 132.2 | 133.4 | 132.8 | 133.6 | 133.7 | 135.7 | 137 | 138.6 |
| 12 | 137.7 | 139 | 138 | 139.1 | 138.9 | 141.1 | 142.2 | 143.8 |
| 13 | 144.2 | 143.2 | 144.3 | 143.1 | 145.2 | 145.1 | 148.4 | 147.7 |
| 14 | 150.6 | 146.2 | 150.5 | 146.1 | 151.5 | 148 | 154.4 | 150.4 |
| 15 | 155.4 | 148.5 | 155.2 | 148.4 | 156.3 | 150.1 | 159 | 152.4 |
| 16 | 158.9 | 150.1 | 158.7 | 150.1 | 159.9 | 151.6 | 162.3 | 153.8 |
| 17 | 161.3 | 151.2 | 161.4 | 151.3 | 162.6 | 152.6 | 164.6 | 154.7 |
| 18 | 162.9 | 151.8 | 163.2 | 152.1 | 164.3 | 153 | 166 | 155.2 |
| 19 | 163.5 | 151.9 | 164.2 | 152.4 | 165.1 | 153 | 166.5 | 155.2 |
Look first at how much each age gained in the most recent ten years, 2009 → 2019, and then add a similar amount again.
| Age | Boys 2009 | Boys 2019 | Gain | Estimate 2029 |
|---|---|---|---|---|
| 5 | 105.1 | 107.1 | +2.0 | ≈ 109 |
| 8 | 120.9 | 123.5 | +2.6 | ≈ 126 |
| 11 | 133.7 | 137.0 | +3.3 | ≈ 140 |
| 14 | 151.5 | 154.4 | +2.9 | ≈ 157 |
| 17 | 162.6 | 164.6 | +2.0 | ≈ 167 |
| 19 | 165.1 | 166.5 | +1.4 | ≈ 168 |
| Age | Girls 2009 | Girls 2019 | Gain | Estimate 2029 |
|---|---|---|---|---|
| 5 | 104.0 | 107.2 | +3.2 | ≈ 110 |
| 8 | 119.6 | 122.7 | +3.1 | ≈ 126 |
| 11 | 135.7 | 138.6 | +2.9 | ≈ 141 |
| 14 | 148.0 | 150.4 | +2.4 | ≈ 153 |
| 17 | 152.6 | 154.7 | +2.1 | ≈ 157 |
| 19 | 153.0 | 155.2 | +2.2 | ≈ 157 |
The rule of thumb: add about 2 to 3 cm to each 2019 value — a little more at the younger ages, a little less at 18 and 19.
The countries are placed along the horizontal line, roughly from the shortest to the tallest. The vertical line shows height in cm and starts at 145 cm (zoomed in). Each country has four marks — × for boys, ▲ for girls; orange for 1989, blue for 2019. Every mark is the average height of 19-year-olds.
| Mark | Meaning |
|---|---|
| Orange × | Boys in 1989 (B-1989) |
| Blue × | Boys in 2019 (B-2019) |
| Orange ▲ | Girls in 1989 (G-1989) |
| Blue ▲ | Girls in 2019 (G-2019) |
- Heights differ a lot between countries — 19-year-old boys average about 184 cm in the Netherlands but only about 160 cm in Timor-Leste.
- In every country the boys are taller than the girls on average.
- Most countries became taller from 1989 to 2019; China and South Korea gained the most, while a few, such as Pakistan, hardly changed.
- India is in the lower part of the chart (boys about 166.5 cm, girls about 155 cm in 2019).
Figure it Out — Pages 129 – 133Section 5.4 Data Detective
(a) The data varies more for the boys than for the girls.
(b) The median number of pockets for the boys is more than that for the girls.
(c) The mean number of pockets for the girls is more than that for the boys.
(d) The maximum number of pockets for boys is greater than that for the girls.
Only (b) is true.
| Number of pockets | 0 | 1 | 2 | 3 | 4 | 5 | 6 | 7 | Total |
|---|---|---|---|---|---|---|---|---|---|
| Boys (dots) | 0 | 0 | 0 | 1 | 4 | 5 | 2 | 0 | 12 |
| Girls (dots) | 1 | 0 | 1 | 4 | 5 | 1 | 1 | 0 | 13 |
Girls: mean = 45 ÷ 13 ≈ 3.46, median = 4, range = 6 − 0 = 6
| Statement | True? | Why |
|---|---|---|
| (a) Data varies more for boys | False | Boys run only from 3 to 6 (range 3). Girls run from 0 to 6 (range 6). The girls vary more. |
| (b) Boys’ median > girls’ median | True | 5 > 4. |
| (c) Girls’ mean > boys’ mean | False | 3.46 < 4.67. It is the other way round. |
| (d) Boys’ maximum > girls’ maximum | False | Both groups have a maximum of 6 pockets. Equal is not “greater than”. |
(a) Find the average number of points scored per game by A.
(b) To find the mean number of points scored per game by C, would you divide the total points by 3 or by 4? Why? What about B?
(c) Who is the best performer?
| Player | Game 1 | Game 2 | Game 3 | Game 4 |
|---|---|---|---|---|
| A | 14 | 16 | 10 | 10 |
| B | 0 | 8 | 6 | 4 |
| C | 8 | 11 | Did not play | 13 |
(a) (14 + 16 + 10 + 10) ÷ 4 = 50 ÷ 4 = 12.5 points per game.
(b) For C, divide by 3: C did not play Game 3, so that game has no value. For B, divide by 4: B played all 4 games, and 0 is a real score. (C: 32 ÷ 3 ≈ 10.67; B: 18 ÷ 4 = 4.5.)
(c) A is the best performer — highest mean (12.5), highest total (50), and never below 10 points.
| Player | Games | Total | Mean per game | Best | Worst |
|---|---|---|---|---|---|
| A | 4 | 50 | 12.5 | 16 | 10 |
| B | 4 | 18 | 4.5 | 8 | 0 |
| C | 3 | 32 | 10.67 | 13 | 8 |
Group 2 did slightly better on both measures, and Group 1’s marks are far more spread out.
Total = 730 Mean = 730 ÷ 10 = 73
Sorted: 39, 48, 56, 75, 76, 81, 85, 85, 90, 95
Median = (76 + 81) ÷ 2 = 78.5
Group 2 (9 students): 68, 59, 73, 86, 47, 79, 90, 93, 86
Total = 681 Mean = 681 ÷ 9 ≈ 75.67
Sorted: 47, 59, 68, 73, 79, 86, 86, 90, 93
Median = 5th value = 79
| Group 1 | Group 2 | |
|---|---|---|
| Number of students | 10 | 9 |
| Mean | 73 | 75.67 |
| Median | 78.5 | 79 |
| Lowest mark | 39 | 47 |
| Highest mark | 95 | 93 |
| Range | 56 | 46 |
| Favourite Sport | Cricket | Basket Ball | Swimming | Hockey | Athletics |
|---|---|---|---|---|---|
| Watching | 1240 | 470 | 510 | 430 | 250 |
| Participating | 620 | 320 | 320 | 250 | 105 |
The largest value is 1240, so take 1 unit length = 200 people and run the vertical line to 1400.
Observations: in every sport more people watch than take part; cricket is the most popular for both watching (1240) and participating (620); athletics is the least popular for both.
Use the median height, 115 cm, as the dividing height. Since 17 is odd and five students are exactly 115 cm tall, the groups can only be as equal as 9 and 8: put the students below 115 cm with two of the 115 cm students, and the rest in the other group.
101, 102, 106, 109, 110, 110, 112, 115, 115, 115, 115, 115, 117, 120, 120, 123, 125
Median = 9th value = 115 cm
Age: the mean (≈ 113.5 cm) and median (115 cm) are close to the 2019 average height at age 6 (about 113 cm), so these students are probably about 6 to 7 years old.
Method: measure every student’s height, find the mean (sum ÷ number of students) and the median (middle of the sorted heights), and draw a dot plot.
Sample answer for a Grade 7 class of 20 students:
149, 150, 150, 151, 152, 152, 154, 156, 158, 164
Sum = 2980 cm Mean = 2980 ÷ 20 = 149 cm
Median = (10th + 11th) ÷ 2 = (148 + 149) ÷ 2 = 148.5 cm
The heights run from 138 cm to 164 cm; the mean (149 cm) and median (148.5 cm) are close, so the data is fairly balanced.
(a) The mean height of students in the other section is 154.2 cm.
(b) The mean height of students in the other section is less than 154.2 cm.
(c) The mean height of students in the other section is more than 154.2 cm.
(d) The mean height of students in the other section cannot be determined.
(d) The mean height of students in the other section cannot be determined.
(a) Write estimated values for the number of skyscrapers in New York, Tokyo, and London.
(b) Are the following statements valid?
(i) Only 12 cities have more skyscrapers than Mumbai.
(ii) Only 7 cities have fewer skyscrapers than Mumbai.
(iii) The tallest building in the world is in Hong Kong.
(a) New York ≈ 315, Tokyo ≈ 165, London ≈ 30 (estimated from the bar lengths).
(b) (i) Valid — 12 cities are above Mumbai on the chart. (ii) Not valid — 7 cities on this chart have fewer, but the chart shows only the top 20 cities; every other city in the world also has fewer. (iii) Not valid — the chart counts how many tall buildings a city has, not how tall any one building is.
| Object | Estimate (in cm) | Measure (in cm) | Positive Difference |
|---|---|---|---|
| Length of a pen | |||
| Length of an eraser | |||
| Length of your palm | |||
| Length of your geometry box | |||
| Length of your math notebook |
Estimate all five lengths first, then measure them, and find each positive difference (larger − smaller).
| Object | Estimate (cm) | Measure (cm) | Positive difference |
|---|---|---|---|
| Length of a pen | 15 | 14 | 1 |
| Length of an eraser | 4 | 5 | 1 |
| Length of your palm | 10 | 17 | 7 |
| Length of your geometry box | 18 | 20 | 2 |
| Length of your math notebook | 25 | 29 | 4 |
= 15 ÷ 5
= 3 cm
Double bar graph: for each object draw two bars side by side — the estimate and the measurement — with a scale such as 1 unit = 5 cm.
(a) Construct a dot plot below showing the data for both weeks.
(b) Describe the mean, median, and any observations you may have about the data.
| Week 1 (9 puzzles) | 410 | 400 | 370 | 340 | 360 | 400 | 320 | 330 | 310 |
|---|---|---|---|---|---|---|---|---|---|
| Week 2 (8 puzzles) | 320 | 290 | 380 | 280 | 270 | 230 | 220 | 240 |
Week 2: mean = 2230 ÷ 8 ≈ 278.75 s; sorted 220, 230, 240, 270, 280, 290, 320, 380 → median = (270 + 280) ÷ 2 = 275 s
Observations: Aditi became much faster in Week 2 (her mean dropped by about 81 s). In Week 2 the 380 s puzzle is an outlier, so the mean is a little above the median.
(a) How Long is a Sentence? Pick any two textbooks from different subjects. Choose any page with a lot of text from each book.
(i) Use a dot plot to describe how many words the sentences have on each page.
(ii) Compare the data of both the pages using mean and median.
(b) What is in a Name? Write down the names of all of your classmates.
(i) Find the mean and median name length (number of letters in a name).
(ii) Visualise the data and describe its variability and central tendency.
(iii) Which starting letters are more popular? Which are less popular?
(iv) What is the median starting letter? What does this say about the number of names starting with the letters A – M and N – Z?
(v) Plot a double-bar graph showing the number of boys’ names and girls’ names that:
• start and end with vowels,
• start with vowels and end with consonants,
• start with consonants and end with vowels,
• start and end with consonants.
Sample answer (part b, 12 classmates): name lengths 5, 4, 6, 5, 5, 5, 6, 5, 6, 5, 5, 6 letters → mean = 63 ÷ 12 = 5.25 letters, median = 5 letters; the lengths vary only from 4 to 6. The sorted initials A, A, D, I, K, M, N, P, R, S, T, V have their median between M and N, so about half the names start with A–M and half with N–Z.
(v) The double-bar graph. Sort every name into one of four boxes and count boys and girls separately.
| Pattern | Example | Boys | Girls |
|---|---|---|---|
| Vowel start, vowel end | Anaya | 0 | 1 |
| Vowel start, consonant end | Aarav, Ishaan | 2 | 0 |
| Consonant start, vowel end | Diya, Meera, Kavya, Priya, Tanvi | 0 | 5 |
| Consonant start, consonant end | Rohan, Sanjay, Vikram, Nikhil | 4 | 0 |
(i) Describe the variability and central tendency of this data. Make a dot plot.
(ii) Do you find anything interesting about this data? Share your observations.
(iii) You can ask any of your family members or friends to do this as well.
(30 days): 2, 3, 2, 4, 5, 6, 1, 2, 3, 3, 2, 5, 7, 1, 2, 3, 2, 4, 5, 6, 0, 2, 3, 3, 2, 4, 6, 1, 2, 3.
Mean = 94 ÷ 30 ≈ 3.13 times a day; median = 3; range = 7 − 0 = 7. The dot plot runs from 0 to 7 with the tallest stack at 2; mean ≈ median, so the data is balanced.
(a) Our heights vs. our family’s heights: Collect the heights of your family members.
(i) Make a dot plot showing heights of just your family members. Describe its variability and central tendency.
(ii) Make a double-bar graph showing each student’s height next to their family’s mean height.
(iii) Look at everyone’s data and share your observations.
(b) Estimating time: Check the time and close your eyes. Open them when you think 1 minute has passed (no counting). Note down after how many seconds you opened your eyes. Collect this data for yourself and for your family members. Repeat this activity to estimate 3 minutes.
(i) Make two dot plots (for 1 minute and 3 minutes) showing estimates of just your family members.
(ii) Mark these on the respective dot plots. Describe its variability and central tendency.
(iii) Make a double bar graph showing each family’s mean 1 minute estimate and mean 3 minute estimate.
(iv) Look at everyone’s data and share your observations.
Sample answer (a): family heights 168, 155, 172, 149, 161 cm → mean = 805 ÷ 5 = 161 cm, median = 161 cm, range = 172 − 149 = 23 cm; no outlier.
Sample answer (b): 1-minute estimates 52, 58, 61, 47, 65 s → mean = 56.6 s, median = 58 s; 3-minute estimates 150, 172, 195, 138, 205 s → mean = median = 172 s. Both are a little short of the true time, and the 3-minute estimates spread much more (range 67 s against 18 s).
Puzzle Time — Connect the Dots…End-of-chapter puzzle
The code is 415.
064: so 4 is in the code, but not in position 3.
542: 4 is also not in position 2 → 4 is in position 1.
265: 2 cannot be in position 1 (4 is there), so 5 is in position 3 and 2 is not in the code.
271: 7 cannot be the correct digit (in position 2 it would be well placed), so 1 is → 1 is in position 2.
| Hint | What the hint says | Check against 415 |
|---|---|---|
| 265 | One correct, well placed | ✔ only 5, and it is in position 3 in both |
| 271 | One correct, wrongly placed | ✔ only 1; shown in position 3, actually in position 2 |
| 542 | Two correct, wrongly placed | ✔ 5 and 4; 5 shown in position 1 (really 3), 4 shown in position 2 (really 1) |
| 036 | Nothing correct | ✔ none of 0, 3, 6 appears in 415 |
| 064 | One correct, wrongly placed | ✔ only 4; shown in position 3, actually in position 1 |
Chapter 13 of 15 – Maths
- Previous: Chapter 12 Another Peek Beyond the Point
- Next: Chapter 14 Constructions and Tilings
- All chapters: NCERT Solutions Class 7 Maths
Also for This Chapter
NCERT Solutions Class 7 Maths Chapter 13 Connecting the Dots… – Overview
| Class | Class 7 |
| Subject | Maths |
| Chapter | 13 – Connecting the Dots… |
| Textbook pages | Part II, 98 – 134 |
| Questions solved | 86 |
| Session | 2027 |
| Format | Full answers on this page + PDF |
NCERT Solutions Class 7 Maths Chapter 13 – FAQs
Where can I download NCERT Solutions Class 7 Maths Chapter 13 Connecting the Dots… PDF?
Read every answer on this page, or download the free PDF from the table at the top.
Is this for the 2027 session?
Yes, it follows the latest NCERT Class 7 Maths book for 2027.
How many questions are solved in NCERT Class 7 Maths Chapter 13?
All 86 questions of the chapter (textbook pages Part II, 98 – 134) – the in-text questions, activities and the end-of-chapter exercises.
How should I use these solutions?
Read the chapter in the NCERT book first, attempt the questions yourself, then check your answers here.